Incrementality testing for B2B: how AI sizes holdouts and reads lift when audiences are small
Incrementality testing shows which pipeline your ads actually caused; here is how AI sizes an account holdout, what platform lift studies require, and how to read the result in opportunities.

Incrementality testing measures what your ads caused by comparing a group that could see them with a randomly chosen group that could not. The gap between the two groups is the lift, the outcomes that would not have happened without the spend. In B2B, the outcome worth testing is pipeline, and the group is usually a list of accounts.
You know the moment this matters. The CFO looks at the LinkedIn line, sees that the attribution tool credits it with 121 opportunities, and asks how many of those accounts would have come in anyway. Nobody in the room knows, because attribution counts who touched an ad and has no way to count who would have bought regardless.
If you run paid media or demand gen, that question is yours to answer, usually with small audiences and long sales cycles. This article covers which test design fits which channel, how to use AI to size the holdout before you spend a dollar, what the platforms' own lift studies require as of November 2026, and how to read the result in pipeline, with a worked example you can copy.
Incrementality measures the pipeline that would not exist without the ads
Incrementality is the difference in outcomes between people or accounts exposed to your ads and a comparable group that was kept from them, so it answers the question attribution cannot: what you would lose if you switched the channel off. Attribution shares out credit among the touches a buyer had. Incrementality asks whether the touch changed anything. Where attribution earns its place is covered in AI attribution for B2B, and this article picks up where it hands over.
The reason to bother is that clever modeling does not replace a control group. A study of 15 US advertising experiments at Facebook, published in Marketing Science in 2019 by Brett Gordon, Florian Zettelmeyer and colleagues, compared randomized results with observational methods on the same campaigns and found that "the observational methods often fail to produce the same effects as the randomized experiments" (Kellogg School of Management). That was with 1.6 billion impressions behind it. A B2B attribution model has far less to work with.
The arithmetic is simple. Lift is the exposed group's rate minus the holdout's rate, and incremental opportunities are that difference multiplied by the number of exposed accounts. Everything hard about incrementality in B2B sits in getting those two rates measured on enough accounts, over enough time, without the groups leaking into each other.
Three test designs fit B2B: account holdouts, matched markets and platform lift studies
Marketing incrementality tests come in three designs, and the channel you're testing mostly chooses for you. An account holdout works where you can exclude a company list, a matched market test (also called a geo lift test) works where you can only control location, and a platform conversion lift study works where the platform randomizes for you and you meet its minimums.
| Design | How the groups are made | Fits best | Outcome you can read | Main weakness |
|---|---|---|---|---|
| Account holdout | You randomly withhold part of your target account list and exclude it from targeting | LinkedIn, and contact-list audiences on Google and Meta | CRM opportunities and pipeline by account | Needs a few thousand accounts to detect a realistic lift |
| Matched market (geo lift) | Ads run in some regions and pause or stay normal in comparable ones | Google and Microsoft search, where you can't exclude companies | Opportunities by account location | B2B buyers and their headquarters often sit in different regions |
| Platform conversion lift | The platform splits members into exposed and control groups | Accounts that meet the platform's spend and conversion minimums | Conversions the platform can see | Counts form fills and tracked events unless CRM stages flow back |
Most B2B teams should start with the account holdout, because it's the only design where the outcome you read is the same opportunity record your CFO already trusts. When AI plans and reads those holdout tests, budget calls can rest on the pipeline a channel created rather than the pipeline it claimed, and Scalewell helps demand gen teams make that shift.
Holdout testing on an account list is the default for B2B
Holdout testing in B2B means randomly setting aside a share of your target accounts, keeping them out of one channel's targeting for the whole test, and comparing how many accounts in each group open an opportunity. The holdout group gets everything else as normal: sales outreach, email, search, events. Only the channel under test is switched off for them.
On LinkedIn, the exclusion is a matched audience. Upload the holdout as a company list and set it to exclude: LinkedIn's own guidance says to "switch the action from Include to Exclude when setting the target audience" (LinkedIn Marketing Solutions). The same page recommends lists of at least 1,000 companies, which is a useful floor for the advertised group too.
Randomize within strata, or the test can be lost before it starts. If tier 1 enterprise accounts land unevenly between the groups by chance, the comparison measures account size, not advertising. Sort the list by tier, industry and size band, then randomize inside each band. AI does this well, and you can check its work in seconds:
You are setting up an account holdout test for LinkedIn ads.
Input: a CSV of target accounts with columns account_id, company_name, domain,
tier (1-3), industry, employee_band, opportunities_last_12_months.
1. Stratify by tier x employee_band. Within each stratum, randomly assign 30% of
   accounts to HOLDOUT and 70% to ADVERTISED, using random seed 2026.
2. Print a balance table: for each group, count of accounts, share by tier, share by
   industry, and the opportunity rate over the last 12 months.
3. Flag any stratum with fewer than 10 accounts and any baseline gap between groups
   larger than 0.5 percentage points.
4. Write two files: holdout.csv and advertised.csv (company_name, domain) in the
   format LinkedIn accepts for a company list upload.
Keep the seed and the balance table. If anyone later asks whether the split was fair, that table is the answer.
AI sizes the holdout before you spend
Sizing the holdout means working out the smallest lift your account list can detect, before launch, so you know whether the test can reach a verdict at all. The inputs are your total accounts, the baseline rate at which those accounts open opportunities over the test window, and how much of the list you hold back. Pull the baseline from last year's CRM data, at the stage your sales team calls a real opportunity and over the same window. AI with code execution turns the three inputs into a table in a minute, which is far cheaper than discovering after six months that the test was never going to conclude.
Here is that table for a hypothetical list of 3,600 accounts that historically opened opportunities at a 3% rate over 180 days. It uses a one-sided z-test for two proportions at 5% significance and 80% power, with unpooled variance, calculated for this article.
| Split (advertised / holdout) | Holdout accounts | Smallest detectable rate in the advertised group | Smallest detectable relative lift |
|---|---|---|---|
| 50 / 50 | 1,800 | 4.58% | 53% |
| 70 / 30 | 1,080 | 4.66% | 55% |
| 80 / 20 | 720 | 4.87% | 62% |
| 90 / 10 | 360 | 5.45% | 82% |
Two things jump out. The first is that a 30% holdout costs very little detection power against a 50/50 split while keeping 70% of the list in market, which makes it a sensible default for most B2B tests. The second is that even the best split can only see a lift above 50%. On 6,000 accounts at the same baseline, a 70/30 split gets that down to 42%. Small lists can only detect big effects, and you want to know that before sales asks why 1,080 good accounts saw no ads.
Use this prompt with your own numbers:
Using Python, calculate the minimum detectable effect for an account holdout test.
Total accounts: [N]. Baseline rate of accounts opening an opportunity in [window] days: [p].
For holdout shares of 10%, 20%, 30% and 50%, use a one-sided two-proportion z-test
at alpha 0.05 and 80% power, with unpooled variance, and report: holdout size, the
smallest detectable rate in the advertised group, and the relative lift.
Then tell me which splits can detect a [X]% relative lift, and if none can, say so plainly.
If no split can detect a lift you'd plausibly expect, you have three honest options: add accounts, lengthen the window so the baseline rate rises, or measure an earlier stage such as sales-accepted meetings. If the measurement stage keeps moving earlier, though, the test stops answering the CFO's question. The same pre-test discipline applies to creative, and AI creative testing covers it for ad-level tests.
Platform conversion lift studies have minimums most B2B accounts miss
Google, LinkedIn and Meta each offer a lift study that randomizes for you, Microsoft has a newer uplift experiment for Performance Max, and as of November 2026 their requirements rule out many B2B accounts.
| Platform | What it offers | Requirements and limits on the official page | Where it lives |
|---|---|---|---|
| Google Ads | Conversion Lift based on users, on Display, Search, Video, Demand Gen, App and Performance Max | At least 1,000 observed conversions and a $5,000 minimum campaign budget; holdback from 1% to 50%; studies can run 7 days, more than 14 recommended; not available for all accounts (Google Ads Help) | Campaigns, then Experiments, then the Lift studies tab |
| Conversion Lift Testing at account or campaign level | $80,000 cumulative budget, 30 to 90 days, Conversions API or Insight Tag set up (LinkedIn Help); "Conclusive results aren't guaranteed" (LinkedIn Help) | Measure, then Test, then Create test, then Conversion Lift test (LinkedIn Help) | |
| Meta | Conversion Lift Measurement with randomized test and control groups | "Conversion Lift Measurement is currently limited"; access is through a Meta representative or a measurement partner (Meta for Developers) | Set up with your Meta representative |
| Microsoft Advertising | Uplift experiments that measure the conversion uplift a Performance Max campaign adds alongside your other campaign types (Microsoft Advertising blog, August 2026) | No minimums in Microsoft's announcement; Search Engine Roundtable reported on July 3, 2026 an open beta comparing exposed and suppressed users over 6 weeks or more (Search Engine Roundtable) | Access requested through Microsoft Advertising chat representatives, per the same report |
Two details matter for B2B. LinkedIn moved its lift results from frequentist to Bayesian methodology in June 2026, and labels a lift statistically significant when it is "90% confident or more" and directional at 80% (LinkedIn Help), so treat directional results as a hint and keep budget decisions for significant ones. And Google says "GCLID imports without hashed PII can't be used in Conversion Lift" and recommends enhanced conversions for leads with hashed customer data, since a control group that never sees an ad has no click to match.
That second point is the big one. A platform lift study measures the conversions the platform can see, which for most B2B accounts means form fills. If you want a platform study to read pipeline, CRM stages have to flow back into the platform first, which is the job of offline conversion tracking.
Measuring incrementality in B2B means reading opportunities, over a long enough window
B2B incrementality measurement has to read an outcome your sales team records, and it has to wait long enough for that outcome to appear. Dreamdata's 2026 LinkedIn Ads Benchmarks Report, built on 3.5 million customer journeys, puts the average time from a first LinkedIn ad impression to closed revenue at 281 days (Dreamdata). No paid team will hold a test open for nine months to count closed revenue.
So read opportunities created, at the stage your sales team calls a real opportunity, over a window of at least two quarters, and treat revenue as a later check rather than the decision metric. Clicks and form fills are the wrong outcome entirely, because an ad can raise form fills from accounts that were never going to buy.
A test has worked when three things hold at the end of the window: a one-sided significance test on the opportunity rates comes in below 5% (or the platform reports statistically significant lift), the lower end of the interval on the difference is above zero, and the incremental pipeline per dollar clears whatever return your finance team expects from the channel. If only the first two hold, the channel causes pipeline but may still cost too much.
A worked example: 3,600 accounts, a 30% holdout and six months on LinkedIn
Imagine a hypothetical B2B software company with 3,600 target accounts, a 3% baseline rate of accounts opening an opportunity in 180 days, and an average opportunity value of $40,000. It runs a 70/30 account holdout on LinkedIn for six months and spends $150,000 on the advertised group. Every figure here is invented.
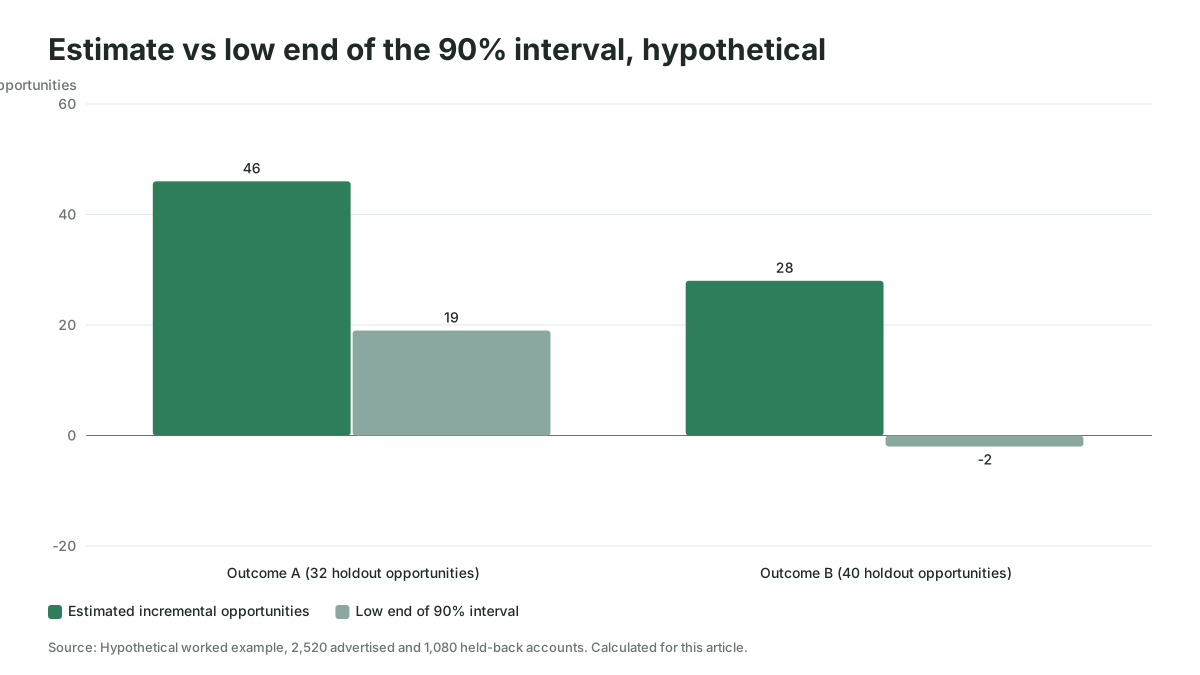
At the end of 180 days, 121 of the 2,520 advertised accounts have opened an opportunity (4.80%), against 32 of the 1,080 held-back accounts (2.96%).
| Measure | Result |
|---|---|
| Difference in opportunity rate | 1.84 percentage points (relative lift 62%) |
| One-sided Fisher's exact test | p = 0.0066 |
| 90% interval on the difference | 0.74 to 2.94 points |
| Incremental opportunities (difference x 2,520) | About 46, with an interval of about 19 to 74 |
| Incremental pipeline at $40,000 each | About $1.85 million, interval about $0.74 million to $2.96 million |
| Incremental pipeline per dollar of spend | About $12, interval about $5 to $20 |
The attribution tool would have credited LinkedIn with all 121 opportunities, $4.84 million of pipeline. The holdout says about 46 of them, roughly 38%, would not have happened without the ads. LinkedIn still pays back handsomely in this example, and the board slide just got smaller and far harder to argue with.
Now change one number. If 40 of the holdout accounts had opened an opportunity (3.70%) instead of 32, the one-sided Fisher's test returns p = 0.083 and the 90% interval runs from minus 0.08 to 2.27 points. That result is inconclusive: the channel's effect could be zero or as large as about 57 opportunities. A good AI readout says exactly that and does not round it up to a win.
The readout prompt keeps the AI honest:
Here are the results of an account holdout test: advertised group [n1] accounts,
[x1] opened an opportunity; holdout group [n2] accounts, [x2] opened an opportunity.
Spend on the advertised group: $[S]. Average opportunity value: $[V].
1. Run a one-sided Fisher's exact test and a two-proportion z-test. Report both p-values.
2. Give the 90% interval on the difference in rates.
3. Convert the difference and its interval into incremental opportunities, incremental
   pipeline and pipeline per dollar of spend.
4. State in one sentence whether the result is conclusive at 5%. If not, give the
   largest effect the interval still allows and do not describe the result as a lift.
5. Compare the incremental opportunities with the [A] opportunities our attribution
   tool credits to this channel and state the incremental share.
Incrementality tests fail in four predictable ways
Most failed B2B incrementality tests break on design or patience rather than on the statistics.
The holdout leaks. A held-back account can still see your ads if a member's profile names the company differently or a colleague in another office is targeted. Pull LinkedIn's demographics report, which shows "company name" for members who interacted with your ads (LinkedIn Help), once a week and have the AI flag any holdout company that appears. Leakage shrinks the measured lift, so a leaky test undersells the channel.
Someone changes the rules mid-test. Sales hears that 1,080 accounts are dark and starts a special outreach push to them, or the advertised group gets a new offer halfway through. Agree with sales before launch that both groups get identical treatment from every other team, and write it down.
The window is too short. Stopping at 60 days on a cycle that runs for months measures the accounts that were already close to buying. Set the readout date before launch and don't peek with the intent to stop early.
The test was never powered. Running a holdout on 400 accounts and reporting "no lift" is no finding at all, because the test could only have seen an enormous effect. AI for ABM advertising walks through that exact trap on a short list. Size first, and if the table says no, don't run it.
Matched market tests add a fifth risk. B2B outcomes are lumpy, a handful of large accounts can sit in one state, and the buyer often works far from headquarters. If you must test search by region, use a design tool such as Google's open-source Meridian GeoX, which needs "historical geo-level KPI daily time series data" (Google for Developers), and assign each opportunity to the region of the person who first engaged rather than to the headquarters.
How Scalewell turns holdout tests into a job AI runs for your team
Scalewell's aim here is a lift number behind every major channel, with AI handling the sizing, the random split, the weekly leak check and the readout. It starts with a free half-hour call and an audit of your team's week that ranks which recurring job to hand to AI first, producing a prioritized roadmap.
A build sprint then sets up the first of those jobs inside software your team already works in, usually across 8 to 12 weeks, occasionally longer. People who have run B2B paid media do the build and measure every job by time saved and pipeline, and your team is trained to operate and tune the result without relying on Scalewell.
A lift result should move budget and calibrate your other models
A conclusive lift result is worth most when it changes a decision and then becomes an input to the next one. Use incremental pipeline per dollar, rather than attributed pipeline, when you compare channels at the next budget review, and give it to whoever runs your AI marketing ROI sums so the performance line rests on a test.
If you run a marketing mix model, each test result is a calibration point for it, and marketing mix modeling with AI explains how the main libraries take lift results in. Then re-test. A result from last year describes last year's creative, audiences and competition, so re-run the holdout on each major channel about once a year, or after any budget change large enough that you'd want to defend it.
An inconclusive result also moves budget, just more gently. It tells you the channel's effect is smaller than the test could see, so hold spend flat, fix what you can, and size a bigger test rather than scaling on faith.
Where to start with incrementality testing
Pull last year's opportunity rate for your target account list over a 180-day window and run the sizing prompt above on it this week; the table tells you whether a holdout on your biggest channel can conclude. Making that sizing, the split and the readout a routine AI runs is work Scalewell does with B2B paid teams, so each channel's budget gets argued from tested pipeline.
Frequently asked questions
What is the difference between incrementality and lift?
Lift is the number an incrementality test produces. Incrementality is the concept, the share of outcomes caused by your ads, and lift is its measurement: the exposed group's rate minus the control group's, often shown as a percentage of the control rate. A 62% relative lift and 46 incremental opportunities describe the same result in two units.
How big should a holdout group be?
There is no universal percentage, because the right size depends on how many accounts you have and how often they open opportunities. For most B2B lists, a holdout of about 30% loses little detection power against a 50/50 split while keeping most accounts in market, while a 10% holdout loses a lot. Run the minimum detectable effect calculation before choosing.
Can you run an incrementality test without a platform lift study?
Yes. An account holdout needs only a randomized company list, an exclusion in the ad platform and your CRM's opportunity records, and it reads pipeline directly. Platform studies randomize at the member level and are easier to set up, but they carry spend and conversion minimums and usually measure tracked conversions rather than opportunities.
What is a conversion lift study?
A conversion lift study is a platform-run incrementality test. The platform randomly splits its users into a group that can see your ads and a control group that cannot, then compares the conversions it tracks in each. Google, LinkedIn and Meta offer one, each with its own budget, conversion and access requirements.
Is incrementality testing worth it for a small B2B advertiser?
Often not as a formal test. If your list is a few hundred accounts, a holdout can only detect very large effects, and platform lift studies will be out of reach. Run the sizing calculation anyway, because "this test cannot conclude" is useful to know, then rely on CRM-matched cost per opportunity and self-reported attribution instead.