AI creative testing: how to plan tests that can conclude and read them honestly
Use AI to check whether a creative test can reach a verdict on your budget before launch, and to read the result honestly once it ends.

AI creative testing works best on the two jobs people skip: checking before launch whether a test can reach a verdict on your budget, and reading the result afterward without seeing a winner in noise. Run the split in the platform's own experiment tool, and give the hypothesis, arithmetic and readout to an AI assistant that runs code.
You know how the usual version goes. Three new LinkedIn ads go live on a Tuesday, one has a CTR of 0.71% by Friday against 0.52% for the others, and by Monday someone has asked for "more like that one." Nobody checked whether 0.71% on a few thousand impressions means anything, and the next round of creative gets briefed on a coin toss.
This guide is for the paid media lead who runs the accounts. It gives you the platform limits as of November 2026, a six-step method with the prompts written out, a worked calculation of what a clean test costs, and the mistakes that make B2B creative tests lie. If you need the earlier stage, turning performance data into a brief worth testing, that lives in our guide to the AI creative brief generator.
You need four things in place before the first test
A creative test needs a tagging scheme, a baseline, a decision metric and a known budget before anything goes live. Skip one and you'll end up arguing about the result instead of using it. With these four in place, tests conclude and feed the next brief, and Scalewell takes on the setup with the team, from the tagging scheme to the budget check before launch.
- A tagging scheme. Every ad carries the same six to ten labels, such as hook type, format, proof and offer, so you can say which element changed. The brief generator article sets out the scheme and how AI applies it.
- A baseline export. Pull 60 to 90 days of ad-level results for the campaign you'll test in. You need the current rate for your decision metric (CTR, lead rate or cost per lead) because the sample size depends on it.
- One decision metric, chosen in advance. Google's own experiments guidance says to "pick one or two metrics to gauge the success of your tests before a test begins." Pick the metric closest to pipeline that your volume can support, which step 2 below works out.
- The test budget as a number. Know what you can spend on the test arms without starving the campaigns that carry your pipeline.
Each platform's test tool sets different limits
The platforms all offer a proper split, where each person sees only one version, but the limits differ a lot, and the B2B accounts usually hit them first. This is what each tool's documentation said when we checked in November 2026.
| Platform and tool | What it splits | Limits that matter | How it calls a result |
|---|---|---|---|
| Meta Creative testing (Ads Manager) | 2 to 5 test ads within one ad set | Highest volume bid strategy only; existing ads can't be tested, so you test duplicates of them | Results in the Experiments section |
| Meta Marketing API creative test (SPLIT_TEST_V2) | 2 to 7 cells, one ad per cell | Cell percentages must sum to 100 | Returns "high performer" ad IDs, no winner confidence |
| Google Ads custom experiments | Search, Display, Video and Hotel campaigns | One experiment runs at a time; Google recommends 2 to 3 weeks | 80% confidence by default, adjustable; blue asterisk marks significance |
| Google Demand Gen "A/B test assets" | Creative as the single variable | 50 conversions per arm needed with conversion bidding | Metrics: CTR, conversion rate, cost per conversion, CPC |
| Google video experiments | Video ads on YouTube, up to 10 arms in custom mode | A/B test video assets only on Video reach and Video view campaigns | Conclusive at 95% confidence |
| Google Performance Max A/B testing assets (Beta) | Two sets of assets in one asset group | Google recommends a minimum of 4 to 6 weeks | Set in the experiment's success metrics |
| LinkedIn A/B test | Two campaigns that differ by one variable | Up to 90 days; each variant needs an audience of at least 1,000,000 | Confidence level from 51% to 99%, LinkedIn recommends at least 90% |
Two rows deserve a closer look for B2B. LinkedIn's A/B testing API documentation lists an error that blocks a test unless "each variant in the test must have an audience size of at least 1,000,000," and a warning that suggests a test budget of $5,000. A tight ICP of 80,000 people at named accounts can't run a formal LinkedIn A/B test at all, so you'll test inside one campaign and lean harder on the arithmetic in step 2. The same documentation lists CPC, CPM, cost per video view and cost per message sent as the KPIs the API optimizes for, so check in Campaign Manager which metrics your test can use before you promise anyone a cost per lead verdict.
On Meta, the ads consultant Jon Loomer describes the Creative testing tool as a way to "prevent Meta from optimizing delivery to specific ads," which is the point. In a normal ad set, Meta shifts delivery toward the ads it predicts will perform, so the ad-level numbers you see in reporting come from unequal, self-selected audiences. Those numbers are useful signals, but they aren't a test. For Google, the Demand Gen experiments page and the Performance Max asset testing page carry the setup details, and our article on AI for Meta ads beyond Advantage+ covers how the automated delivery side behaves.
The method runs in six steps, with AI on the hypothesis, the arithmetic and the readout
The steps below assume an AI assistant that can run code on a file you upload. As of November 2026, Claude's code execution and file creation is available on every plan, including Free, and handles CSV files up to 30MB. Any other assistant that can run code on an uploaded file works the same way. Running code matters because you want the sums calculated by Python, not estimated in a paragraph of prose.
1. Write one hypothesis that changes one element
A testable creative hypothesis names the single element that changes, the control it is measured against, the metric, the lift you expect and the reason you expect it. Give the AI your tagged export and ask it to propose hypotheses, then pick one yourself.
You are helping plan a paid social creative test.
Attached: ad-level export for the last 90 days, with these tag columns:
hook_type, format, proof_type, offer, cta. Decision metric: [CTR / lead rate / CPL].

1. Rank tag values by the decision metric, showing the ad count and spend behind each.
   Exclude any value with fewer than 3 ads or less than [floor] spend.
2. Propose 3 hypotheses. Each must change exactly ONE tag value against a named control ad,
   and state: element changed, control ad, metric, expected relative lift, and the reason.
3. For each, list what must stay identical between versions (offer, audience, placement,
   format, copy length).
Do not propose a hypothesis based on a tag value with fewer than 3 ads.
The output is a short list where every line reads like "Swap the stat hook for a named-customer hook on ad 14, expect a 20% higher CTR, because the two customer ads in the set beat the average." If the AI proposes something that changes the image and the headline together, send it back. A test with two changes can tell you that a version won, but it can't tell you which change did the work.
2. Check that the test can reach a verdict before you spend
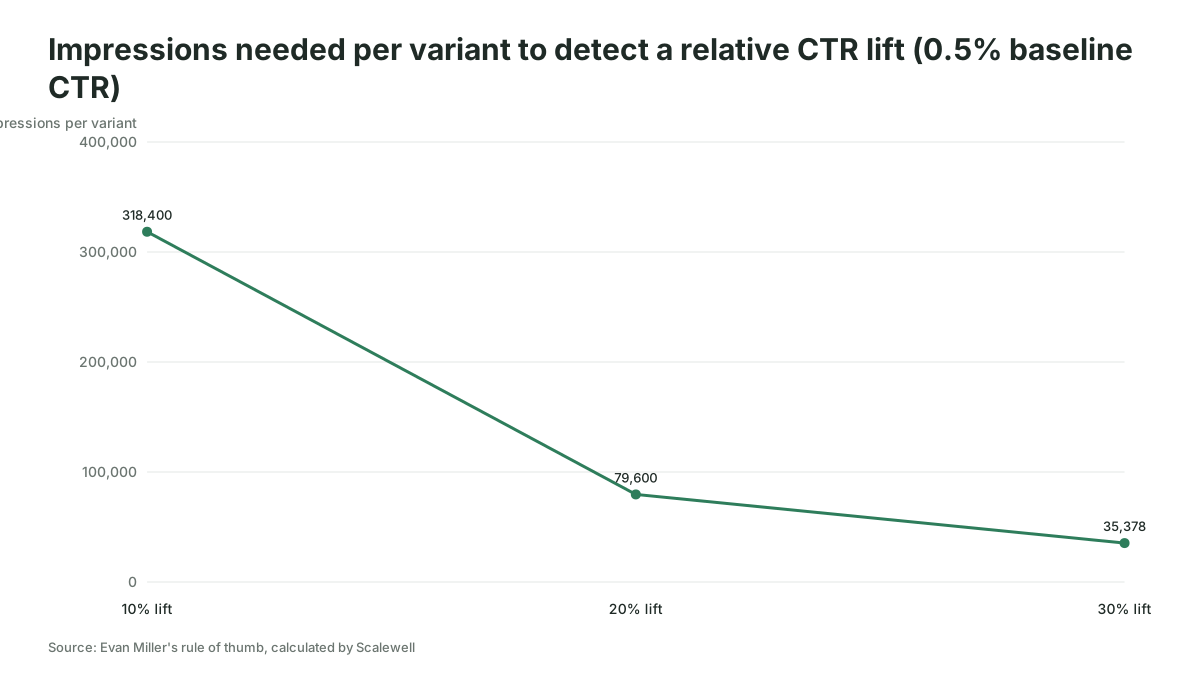
The pre-test check works out how much traffic each version needs to detect the lift you care about, then converts it to money. Evan Miller's widely cited article How not to run an A/B test gives a rule of thumb for the sample per version: n = 16σ²/δ², where δ is the smallest effect you want to detect and σ² is p × (1 − p) for a rate p.
Using Python, calculate the sample size per variant for this test with n = 16 * p * (1 - p) / d^2,
where p = [baseline rate as a decimal] and d = p * [minimum relative lift as a decimal].
Then convert to spend: impressions per variant x CPM / 1000 (or clicks x CPC).
Show the result for relative lifts of 10%, 20% and 30%, and the number of days each takes at
[daily test budget]. Flag any option that needs more than [max days] days.
Show the code you ran.
If every option takes longer than your patience or your budget, you have three honest choices: test a bigger difference (a new concept rather than a new button color), move the decision metric up the funnel, or don't run the test and say so. All three beat running a test that was never going to conclude.
3. Set the test up in the platform's own tool
The platform's experiment tool is the only place the audiences are properly split, so set the test up there and keep the AI out of delivery. Match the tool to the row in the table above: Meta's Creative testing for two to five ads within one ad set, a Google custom or asset experiment, or a LinkedIn A/B test if your audience clears 1,000,000 per variant. Enter the end date from step 2 and, where the tool allows it, the confidence level you decided on. On Google, that means changing the 80% default if you want a stricter bar.
4. Leave the test alone until the end date
Checking a test daily and stopping the moment it looks significant inflates false winners. Evan Miller's worked example shows that an experiment where the new version has no effect at all, checked after every observation and stopped at the first 5% significance reading, produces a false positive 26.1% of the time, "more than five times what you probably thought the significance level was." It's a worst case, but daily peeking at a creative test lands closer to it than most of us like to admit. So write the end date in the test name and don't open the results tab until then.
5. Read the result with code, and treat "no winner" as a finding
The readout asks the AI to run a significance test on the exported numbers and to report the confidence interval alongside the point estimate. Platform tools give you a verdict too, but an independent readout catches the cases where the tool says "no winner" and someone still wants to declare one.
Attached: final results for test [name]. Control = [ad], treatment = [ad].
Decision metric: [metric], decided before launch. Confidence level: [90/95]%.

Using Python:
1. Run a two-proportion z-test on the decision metric. Report both rates, the absolute and
   relative difference, the p-value and the confidence interval for the difference.
2. Say in one sentence whether the result clears the confidence level.
3. If it does not, report the smallest lift this sample could have detected.
4. List any secondary metrics separately and label them "not the decision metric."
Do not describe a result that misses the confidence level as "trending," "directional"
or "promising." Show the code.
The last instruction is there because language models, like account managers, like a happy ending. A test that doesn't clear the bar still tells you something useful: the two versions perform within a range you can now quantify, so choose on cost or brand fit and spend the next test on a bigger idea. LinkedIn's documentation makes the same point, and suggests that a no-winner result with a small minimum detectable effect means "there's no practical difference between the two cells."
6. Confirm the winner in the CRM, then log it
A creative that wins on CTR or cost per lead still has to produce pipeline, so check the leads it generated against your CRM before you scale it. This is where most B2B creative testing earns or loses its keep, because two ads that tie on CTR or cost per lead can be far apart on cost per opportunity.
Log each test in one row: hypothesis, element changed, dates, spend, result with its interval, CRM check, decision. That log becomes the input to the next round of briefs, and after a few quarters it's the most useful creative document your team owns.
A worked example shows why most B2B tests should run on CTR first
Imagine a hypothetical software company testing a named-customer hook against its usual stat hook on LinkedIn. Its baseline CTR is 0.5%, its CPM is $40, and it wants to detect a 20% relative lift, from 0.5% to 0.6%.
| Decision metric | Baseline | Lift to detect | Sample per variant | Cost per variant | Cost for both |
|---|---|---|---|---|---|
| CTR | 0.5% | 20% (to 0.6%) | 79,600 impressions | $3,184 at $40 CPM | $6,368 |
| Lead rate per click | 10% | 20% (to 12%) | 3,600 clicks | $36,000 at $10 CPC | $72,000 |
| Opportunities | Too few to test | n/a | n/a | n/a | n/a |
All figures are hypothetical and calculated with the rule of thumb in step 2. The CTR test costs about as much as one month of a modest LinkedIn budget. The lead-rate test costs more than ten times as much, which is beyond most B2B teams for a single creative question. And no team will ever reach a statistically clean verdict on opportunities from one creative test.
So the practical order for this company is a CTR test to choose between the versions, followed by the CRM check from step 6 to make sure the CTR winner isn't pulling the wrong people.
Where AI creative testing goes wrong
Most ad creative testing failures come from running tests that could never conclude, or reading them generously, and AI tools make both easier to do at volume.
- Too many versions for the budget. Six versions split the traffic six ways, and each arm needs the full sample from step 2. Generating 40 variants with AI is cheap, but testing them is not. Our article on AI generated ads for B2B covers what to make; test two or three of them at a time.
- Letting the model do arithmetic in prose. A language model asked "is 0.71% better than 0.52%?" can answer confidently without calculating anything. Make it run the test in code and show the code, every time.
- Testing on a metric that can't reach the CRM. A CTR winner that brings in students and job seekers is a loss, and only the step 6 check catches it.
- Testing small changes on small audiences. A button color test on a 60,000-person ICP is very unlikely to conclude. Test concepts, hooks and offers, where the lifts are large enough to detect.
If your account spends a few thousand dollars a month on one platform, formal tests will rarely conclude. Run the arithmetic anyway, then rotate creative on judgment and the CRM check, and save formal tests for the questions big enough to justify a month of budget.
Your testing program is working when the log changes the briefs
A creative testing program is working when most tests reach a verdict on the date planned and the log changes what the next brief asks for. Three measures tell you: the share of tests that concluded (winner or confirmed no-difference) against those abandoned or stopped early, the share of winners that held up in the CRM check, and whether the creative team can name the last three things you learned. If the CRM check keeps overturning winners, move your decision metric one step down the funnel. If most tests end inconclusive, your hypotheses are too timid for your budget.
For pulling the exports without copy and paste, the routes for connecting an AI assistant directly to your ad accounts are covered in our guides to the Meta Ads MCP and the LinkedIn Ads MCP.
Where to start this week
Take the test you were about to launch, run the step 2 prompt on it, and see whether it can conclude on your budget before you spend anything. If you'd like the hypothesis, sizing and readout steps set up as a repeatable skill for your team, Scalewell can build that with you.
Frequently asked questions
How long should a creative test run?
A creative test should run until it reaches the sample size you calculated before launch, and for at least one full week so weekday and weekend behavior both appear. Google recommends 2 to 3 weeks for custom experiments and at least 4 to 6 weeks for Performance Max asset tests. LinkedIn caps A/B tests at 90 days.
Can AI predict which ad will win before I spend anything?
AI tools can score creative before launch against patterns in past ads, and the scores can help you shortlist. They cannot tell you how your current audience will respond to an idea it hasn't seen. Treat a predicted score as a reason to test a version, never as the result of a test.
Can I test creative inside a Performance Max campaign?
Yes, as of November 2026, through Google's A/B testing assets experiment, which is still labeled Beta. It compares two sets of assets within a single asset group, while assets you leave out of both sets keep serving to all traffic. Google recommends running it for a minimum of 4 to 6 weeks.
What confidence level should I use for ad creative tests?
Use 90% for routine creative decisions and 95% when the result will shape a quarter of briefs or a large budget move. LinkedIn recommends at least 90%, Google Ads custom experiments default to 80% and let you change it, and Google's video experiments treat 95% as conclusive. Decide the level before launch.
How many ad variations should I test at once?
Test two versions in most B2B accounts, and three at most. Each extra version needs its own full sample, so a four-way test costs at least twice as much as a two-way test to reach the same verdict. Meta's Creative testing tool allows up to five new ads, but your budget usually sets the real limit.