Marketing mix modeling with AI: how to use it for budget allocation, and when not to
Marketing mix modeling with AI is faster to build than ever, but the sample size arithmetic has not changed; here is the data gate, the three open source libraries, the vendor route and the seven steps to a budget shift you can defend.

Marketing mix modeling with AI means fitting a statistical model to two or more years of weekly spend and outcome data, letting machine learning search the model settings, and using the result to move budget between channels. The AI is real but narrow. It speeds up the fitting and the write-up. It does nothing about the data you don't have.
You usually meet the question at the annual budget review. The CFO wants to know what each channel returned last year, the attribution report says one thing, three platform dashboards say three other things, and someone suggests "we should just do an MMM, the open source ones use AI now." That sentence is where a lot of expensive quarters begin. Scalewell works with marketing leaders on where AI earns its place in measurement, so the budget review rests on numbers the team can explain to the CFO.
This article is for the marketing leader who has to decide whether to build one, buy one, or wait. It covers what Meta's Robyn, Google's Meridian and PyMC-Marketing require from your data, as documented by each project in November 2026, where AI genuinely helps, and a plain rule for when marketing mix modeling is the wrong tool for your team.
AI sits in two places in modern MMM, and neither replaces the data
AI in marketing mix modeling means two different things, and a vendor selling "AI MMM" rarely says which one: the fitting engine, or a language model that helps you write and read the model. Both are useful, and both sit downstream of a dataset that most B2B paid teams don't yet have.
The fitting engine is the older meaning. Meta describes Robyn as an "experimental, AI/ML-powered and open sourced Marketing Mix Modeling (MMM) package from Meta Marketing Science" on its GitHub page, and the AI there is Nevergrad, Meta's gradient-free optimizer, searching adstock and saturation settings for you. Robyn's docs call this multi-objective hyperparameter optimization "the most important innovation in Robyn". Google's Meridian and PyMC-Marketing take the Bayesian route and sample the model with MCMC, which gives you a credible interval around every channel's return rather than a single number. None of this is generative AI, and Meridian is the one that recommends a GPU.
The second meaning arrived with large language models, and as of November 2026 it looks like this. PyMC Labs and the agency 1749 publish MMM-GPT, a custom GPT on ChatGPT that answers questions about PyMC-Marketing and helps with "building strategic models to writing the code". The PyMC-Marketing repository ships Claude Code and Cursor instructions, which means the maintainers have set it up for an analyst working with a coding agent. Vendors have moved the same way: Measured calls itself "the AI-powered marketing effectiveness platform", and Haus lists an agent named Architect that reads its causal data and recommends next steps.
So a coding agent can now write your data pipeline, fit a Bayesian model and draft the memo far faster than an analyst working by hand, which matters for the cost of the exercise. It changes nothing about whether the model's answer is true, and the rest of this article is mostly about that.
Check your data passes the sample size test before you pick a tool
Every major MMM project asks for about two years of weekly data or more, and the reason is arithmetic rather than tradition. Robyn's analyst guide says an MMM "will need a minimum of two years of historical weekly data". Meridian's data collection guide asks for "a minimum of two years' worth of weekly data for geo-level models" and "three years of data for national-level models". PyMC-Marketing's MMM introduction says the same thing more gently: "ideally 2-3 years".
The arithmetic comes from a 2017 Google paper, Challenges and Opportunities in Media Mix Modeling by David Chan and Mike Perry. They point out that "three years of national weekly data is only 156 data points", that modeling a lagged effect and a diminishing return "might require 3 - 4 parameters for each channel", and that a rule of thumb for a stable regression is "7-10 data points per parameter, of which typical MMMs fall short". Meridian's amount of data page runs the same sum: in its worked example, two years of weekly national data, 104 points, comes out at four data points per parameter, and "This sample size is too low to estimate the model reliably."
Here is what that looks like for a team you'd recognize. Imagine a B2B SaaS company running five paid channels, say Google Search, LinkedIn, Meta, programmatic display and YouTube, with 18 months of clean weekly data, which is 78 observations. Five channels at three to four parameters each is 15 to 20 parameters before you add an intercept, trend, seasonality and two control variables, so call it 22 to 27 in total. You are fitting roughly three observations per parameter. The model will still run and the output will look precise. But when you re-fit it next quarter with 13 more weeks, LinkedIn's return could halve or double without anything having changed in the market, because the data never pinned it down in the first place. This is a hypothetical, but the ratio is the one your analyst will face.
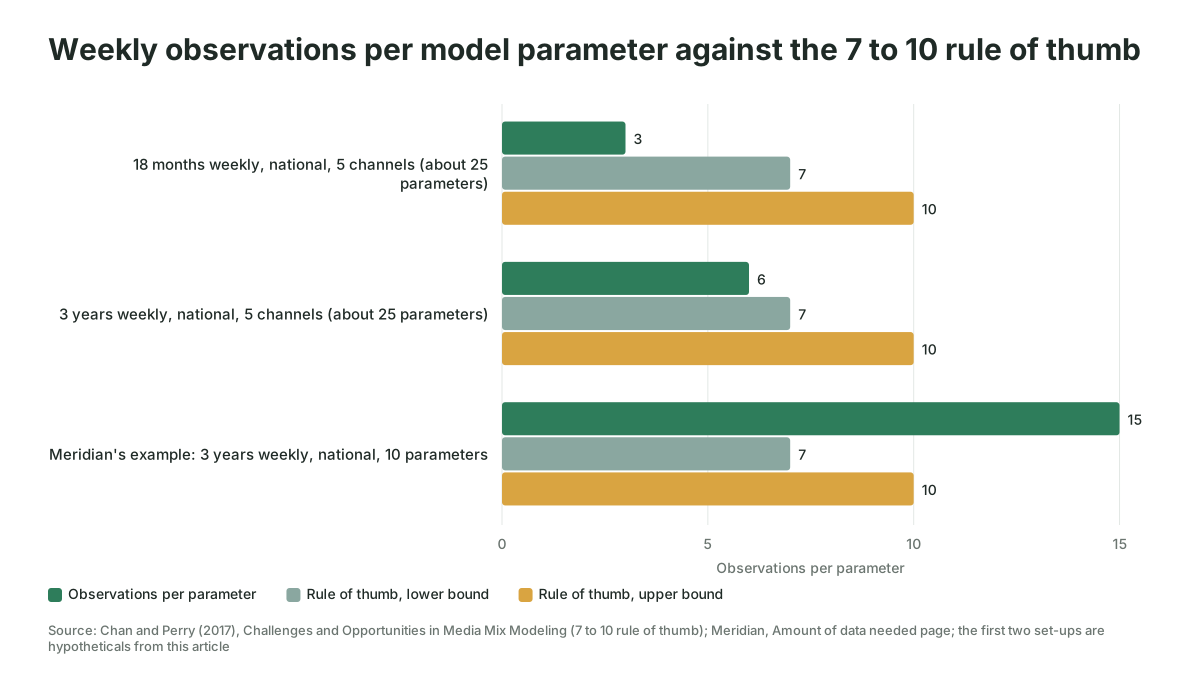
Geo-level data is the way out, and it is the reason Meridian pushes you toward it. Meridian's geo-level modeling page gives "a rough guideline is to model the top 50-100 DMAs by population size" for US advertisers, and explains that pooling across geos "Increases the effective sample size". A B2B team has a snag here: LinkedIn and most ABM spend is bought nationally, so there is no geo variation to learn from. Meridian's answer is to impute national media to geos by population share and accept that it "can still yield useful information about the model parameters". It works, and you should know going in that your flagship B2B channel is the one the model will be least sure about.
Use this as the gate before any tool conversation:
| Your data | What to do |
|---|---|
| Under 12 months of weekly data, or channels launched in the last year | Do not build an MMM yet. Run holdout or geo tests on your two biggest channels and keep a CRM-matched cost per opportunity report. |
| 12 to 24 months weekly, national only, five or fewer channels | A simple model is possible but directional. Fit it only if you calibrate it with at least one experiment, and present intervals, never point estimates. |
| 24 months or more weekly, with usable geo splits | Build in-house with one of the three libraries below, or hire a partner to do the first version. |
| 24 months or more, but nobody on the team can read a posterior | Buy a vendor platform or a certified partner. The data is ready even if the team is not. |
Three open source MMM libraries cover most in-house builds
Three open source MMM libraries are worth your analyst's time as of November 2026: Meta's Robyn, Google's Meridian and PyMC Labs' PyMC-Marketing. Google's earlier LightweightMMM was archived on 19 January 2026 and its README tells you to "switch to Meridian". Everything in the table is taken from each project's documentation and package registry on 8 November 2026.
| Robyn | Meridian | PyMC-Marketing | |
|---|---|---|---|
| Maker | Meta Marketing Science | PyMC Labs, with the PyMC core developers | |
| Language | R (CRAN 3.12.1, published 2 July 2025) with a Python port robynpy 0.3.6 in beta (April 2025) | Python 3.11 to 3.13, google-meridian 2.2.0 (5 November 2026), GPU recommended | Python 3.12 or later, pymc-marketing 1.3.0 (22 October 2026) |
| Method | Ridge regression with Nevergrad evolutionary hyperparameter search, Prophet for trend and seasonality | Bayesian model sampled with NUTS, geo-level with hierarchical pooling, reach and frequency inputs, Google Query Volume as a control | Bayesian model in PyMC with custom priors, time-varying intercept and media effects, CLV models in the same library |
| Experiment calibration | Lift results enter the optimizer as an objective, measured by MAPE on the experiments | CalibrationBuilder turns incrementality results into ROI priors; GeoX runs the geo experiments | add_lift_test_measurements adds each test as an extra observation on the saturation curve |
| Budget allocator | Maximum response for a fixed budget, or target ROAS or CPA | Fixed budget, target total ROI, or target channel marginal ROI, via the Scenario Planner | SLSQP optimizer with total and per-channel constraints |
| Model selection | Pareto front on NRMSE and DECOMP.RSSD, analyst picks | Credible intervals and convergence diagnostics | Credible intervals and convergence diagnostics |
| License | MIT | Apache 2.0 | Apache 2.0 |
The difference between them is less about accuracy than about who is on your team. Robyn suits an analyst who lives in R and wants the machine to propose candidate models for a human to pick from; the docs are candid that model refresh "is not yet tested thoroughly". Meridian suits advertisers with geo data and YouTube spend, because reach and frequency modeling is a feature the others lack, and its MMM Data Platform will pull your Google Ads and DV360 data, though it "can take up to three weeks for the final delivery of data". PyMC-Marketing suits a team that wants to write priors in plain Python, cares about time-varying effects, and intends to let a coding agent do the typing, since it ships agent instructions in its own repository.
We'd avoid choosing on the "AI" label. All three use the carryover and saturation ideas formalized in the 2017 Google paper by Jin and colleagues, and that paper's own warning applies to all three: "prior distributions have a big impact on the posteriors when the sample size is small". A fancier optimizer does not change your sample size.
Vendor platforms trade control for a model someone else keeps fresh
A vendor MMM platform is the right call when your data passes the gate but you have no one to run the model every month. The trade is clear: you lose the ability to inspect and change the model, and you gain a refreshed read without hiring a statistician. Three vendors describe their offer plainly enough on their own sites to be worth naming, and we recommend none over the others.
Recast says it is "Powered by a proprietary Bayesian MMM", cites "3,000+ production models refreshed on demand", and says "Every lift finding feeds back into your MMM to sharpen its estimates over time". Haus sells incrementality experiments first and a "Causal MMM" that is "updated every week", and claims to analyze "$30B+ in ad spend every year". Measured describes "Causal MMM calibrated with incrementality tests" and "Automated geo and audience split experiments". None of the three publishes a price or a minimum spend on its public site (Haus lists four plan tiers without amounts), so the tool budget starts with a sales call.
Google also lists 53 certified Meridian and GeoX partners as of November 2026, and has announced Meridian Studio, a "Cloud-powered enterprise platform" for running "up to hundreds of models simultaneously", with no stated release date or price.
The decision rule we'd use: if the person who will read the model's output every month is a marketing leader rather than an analyst, buy or hire. If an analyst with Python and a coding agent will own it, build, because the open source libraries now include the calibration and allocation features that used to justify a vendor.
Seven steps to a budget allocation you can defend
A defensible MMM budget allocation comes from a fixed sequence, and the AI helps at several steps without taking any of them away from you. Here is the order we'd follow with a team that has passed the data gate; the demand generation planning cycle article covers where this sits in the year.
- Choose a KPI that adds up. Meridian requires that the KPI "is summable across both geography and time", so revenue, closed-won deals or sales-accepted opportunities qualify, and a rate such as conversion rate or CTR does not. For a B2B team with a six-month cycle, opportunities created is usually the least bad choice, because revenue lags the spend by more weeks than an adstock curve can carry.
- Build the weekly table by channel, with exposure rather than spend where you can. Meridian's guide wants "A single media exposure metric, such as impressions, clicks, or spend" per channel, and warns that if you use spend, "periods of high ad cost might be interpreted as high ad volume". This is the step a coding agent genuinely shortens, because pulling two years of weekly impressions from four ad platforms and a CRM is mostly repetitive code.
- Add the controls that explain demand you didn't buy. Chan and Perry call paid search "a severe form of selection bias" because it targets query volume driven by demand that also drives sales, and their fix is to add search volume for relevant queries as a control. Meridian's docs say the same with Google Query Volume. For B2B, add sales headcount and any pricing or packaging change as well.
- Decide geo or national. Use geo-level if you have 24 months of weekly data across 30 or more markets with real variation in spend. Otherwise accept a national model and treat the output as directional.
- Calibrate with at least one experiment before you trust a single number. All three libraries take lift test results as inputs, and Meridian's calibration page is honest that "There is no single formula to translate an experiment result into a prior". A paused-region test on your biggest channel is the one experiment worth running before the first fit.
- Fit, then read the intervals and the diagnostics, not the headline. With Robyn, pick from the Pareto front on prediction error and decomposition distance; with Meridian or PyMC-Marketing, check convergence and the width of the credible interval on each channel. A channel whose interval runs from a loss to a 4x return has not been measured, however neat the chart.
- Move budget in steps and re-test the biggest move. Run the allocator's fixed-budget scenario, shift no more than the allocator suggests for the two channels with the tightest intervals, hold the rest, and schedule a geo test on the largest shift. The monthly spend discipline that makes this safe is covered in the PPC budget pacing article.
Here is what step 7 looks like for the five-channel SaaS team from the data gate, as a hypothetical with invented figures. Imagine they spend $200,000 a month, fitted the directional model their 18 months allow, and calibrated it with one holdout on Search. The allocator starts out cautious: Meridian's optimizer keeps every channel between 70% and 130% of its current spend in a fixed-budget run unless you widen the bounds, and Robyn's demo script uses a floor of 70% and a ceiling of 120% to 150% in its first allocator example, as of November 2026.
| Channel | Spend a month | 90% interval, pipeline per dollar | Allocator's fixed-budget move | Under the tight-interval rule |
|---|---|---|---|---|
| Google Search | $80,000 | 1.9x to 3.0x | +$12,000 | +$9,000 |
| $60,000 | 0.8x to 3.9x | +$5,000 | Hold | |
| Meta | $30,000 | 0.7x to 1.4x | -$9,000 | -$9,000 |
| Programmatic display | $15,000 | 0.2x to 2.6x | -$4,500 | Hold |
| YouTube | $15,000 | 0.3x to 3.1x | -$3,500 | Hold |
Search and Meta are the two channels the model measured, Search because the holdout calibrated it and a query volume control sits behind it, Meta because the team paused it twice in 18 months. So the only move is $9,000 a month from Meta to Search, 4.5% of the budget, and Search gets less than the allocator asked for because no other channel releases money. Display looks like the weakest channel and stays where it is, since an interval from 0.2x to 2.6x means the model cannot tell whether it is the worst channel or the second best. LinkedIn stays for the same reason, and the CFO exchange later in this article is that conversation. The geo test belongs on the Search increase: run the extra $9,000 in half of your US states for eight weeks, hold the other half flat, and let the difference in opportunities created decide whether the next step is another $9,000 or a reversal.

Where does the language model fit? At steps 2, 3 and 6, and in the memo afterwards. It writes the data pulls, drafts the control variable list from your calendar of launches and price changes, reads the diagnostics back to you in English, and turns a posterior plot into three sentences a CFO will accept. It should never choose the KPI, decide which experiment to run or sign off the budget shift.
Where MMM goes wrong for B2B paid teams
Marketing mix modeling fails B2B paid teams for four reasons that most guides leave out, and three of them are about the data rather than the model.
Selection bias on the channels you care most about. Chan and Perry write that "Selection bias from MMMs perhaps represents the largest hurdle to MMMs providing valid estimates of advertising effectiveness" and that "Ad targeting is particularly acute in digital channels", with remarketing and paid search as the two severe cases. A B2B paid program is mostly targeted digital media aimed at people already showing intent. The model sees spend rise when demand rises and credits the spend. Meridian's assumptions page admits it: whether all confounders are measured is something for which "there is no statistical test to determine this from your data".
Too many small channels. A $4,000 a month test on a new platform has almost no variance to learn from. Meridian's guidance when the data runs short is to "consider combining media channels or dropping a media channel with low spend", and its own national example combines 12 channels into three. Do that before the fit, or the model will hand you a confident return on a channel it never saw move. We could find no credible public figure for a minimum monthly spend per channel, so treat any vendor threshold you are quoted as that vendor's rule of thumb.
Short history and recent launches. If LinkedIn started 14 months ago, the model has about 60 weeks of it and nothing from the same season a year earlier, which is the case the data gate above exists for.
Reading a point estimate. This is the one failure that is about people rather than data. A Bayesian MMM gives you a distribution for every channel, and the budget slide collapses it into a single ROI because that is what budget slides look like. Keep the interval on the slide, and if the CFO asks why the number has a range, you are finally having the right conversation.
Imagine the exchange at the review: the CFO asks what LinkedIn returned, the CMO says the model puts it at 2.1x, and the analyst adds that the 90% interval runs from 0.8x to 3.9x. Every head in the room turns to the analyst, and the budget decision just got more honest. That is the exchange you want.
The way to tell the model worked is a test, never a fit statistic
An MMM has worked when a budget move it recommended was confirmed by an experiment after the move, and the model's next refresh moved less than the last one. Fit statistics tell you the model describes the past. The allocator's recommendation is a prediction about the future, and only a holdout or a geo test checks a prediction.
Robyn's docs put it bluntly: "we strongly recommend using experimental and causal results that are considered to be the ground truth to calibrate MMM". PyMC-Marketing describes lift tests as acting "as additional observations of the saturation curve", and that is the right mental model, because each test pins down one point on a curve the regression was otherwise guessing. One experiment a quarter on your largest channel makes the model better every quarter, and none at all leaves you with a well-dressed opinion.
If you also want to put a number on what the AI tooling itself returned, the method in how to measure the ROI of AI in your paid team applies here too: count the analyst hours the agent saved, and keep them separate from any lift the reallocation produced.
Where to start this quarter
Start by counting your weekly observations and dividing by the parameters a five-channel model needs, and let that number decide whether this year is for a model or for experiments. If your team wants a second pair of hands to set the data pipeline, the model and the review memo up around how you already plan, that is the work Scalewell does with paid teams.
Frequently asked questions
Is marketing mix modeling the same as multi-touch attribution?
No, they answer different questions. Attribution assigns credit to the touchpoints in a tracked user journey, so it needs user-level data and misses anything untracked. Marketing mix modeling uses aggregated weekly data and estimates each channel's effect statistically; Robyn's docs call it "Privacy friendly, with no requirement for PII or Individual log level data". Most teams end up needing both.
How often should an MMM be refreshed?
Refresh when you have enough new data to change the answer, which for a weekly model is usually quarterly. Vendors refresh weekly or on demand, but a weekly refresh of a model fitted on 104 points mostly re-reports noise, so match the cadence to your data, not to the vendor.
Can ChatGPT or Claude build a marketing mix model?
A coding agent can write the pipeline and fit the model in PyMC-Marketing or Meridian, and PyMC-Marketing ships Claude Code and Cursor instructions for exactly that as of November 2026. It cannot supply the two years of weekly data, choose the KPI, or run the experiment that calibrates the result. Treat it as a fast analyst, never as the judge.
Do I need geo-level data for an MMM?
You need it for a reliable national-channel read with fewer than three years of history. Meridian recommends geo-level data because pooling across geos raises the effective sample size, and suggests the top 50 to 100 US DMAs. For a B2B team whose spend is national, geo data mainly helps on search and social, which is still better than nothing.
What does an open source MMM cost to run?
The software is free under MIT or Apache 2.0 licenses. The real costs are analyst time, a GPU or cloud instance for Meridian, and the experiments needed to calibrate it. Budget for the experiments first, because without them the model is wasted.