B2B marketing ROI for the board: how to report AI's effect on pipeline, CAC payback and velocity
The four numbers a board trusts, the formulas finance will check, a grade of proof for every AI claim, and a filled-in hypothetical board slide.
To report B2B marketing ROI to a board, show four numbers finance already trusts: marketing ROI on gross profit, CAC payback, pipeline velocity and sourced pipeline. Then add one line on AI that grades every claim by its proof: proven by a holdout, measured before and after, or only claimed by attribution. Boards fund what they can audit.
The board pre-read is due Thursday, and its AI line says "AI-assisted campaigns drove 35% more conversions." In an imagined but familiar exchange, the CFO reads it first and asks a single question: "More conversions of what, and would we have had them anyway?" Nobody on the marketing side has an answer that fits on the slide.
What follows is written for the marketing leader who owns that slide: the CMO metrics that belong on it, the formulas finance will check, what counts as proof for AI, and a filled-in one-page board slide with every sum shown.
The board wants four numbers finance already trusts, plus one line on AI
A board judges marketing on the same unit economics it uses for the rest of the company: what the spend returned, how fast it came back, and whether the engine is speeding up. Those questions map onto four CMO KPIs, and none of them is a lead count.
The pressure behind them is real. In Gartner's 2026 CMO Spend Survey, which polled 401 CMOs and other marketing professionals between January and March 2026, marketing budgets came to 7.8% of company revenue, against 7.7% in 2025, and 15.3% of marketing budgets on average went to AI (Gartner, as reported by Marketing Dive on May 11, 2026). So nearly 8 cents of every revenue dollar goes to marketing, and about 15 cents of each marketing dollar now goes to AI. NIQ's CMO Outlook, a survey of more than 250 senior marketers published in December 2025, found 84% of CMOs cited marketing ROI as their most popular metric for allocating budget across media.
| Metric | Formula | Question it answers | Owner of the inputs |
|---|---|---|---|
| Marketing ROI | (Gross profit from marketing-sourced revenue − marketing cost) ÷ marketing cost | What did the money return? | Finance (margin, cost), CRM (revenue) |
| CAC payback | Sales and marketing expense ÷ (new ARR × gross margin) × 12 | How many months until a new customer pays back? | Finance |
| Pipeline velocity | (Opportunities × average deal value × win rate) ÷ sales cycle length in days | Is revenue moving faster than last quarter? | CRM, sales ops |
| Sourced pipeline | Sum of opportunity value created where marketing was the agreed source | How much future revenue did marketing start? | CRM, signed off by sales |
Scalewell helps marketing teams have AI prepare this pack from the CRM and the ad platforms each month, so the leader's prep time goes into the decision the board is asked to make rather than into reconciling exports.
A B2B marketing ROI calculation needs gross margin and an agreed time horizon
Marketing ROI for a B2B company is the gross profit from marketing-sourced revenue, minus marketing cost, divided by marketing cost. Two choices decide the answer, and both should be made with finance before the number appears in a deck.
The first choice is revenue or gross profit. Revenue makes the number look bigger and invites the CFO to recalculate it in front of the board, so use gross profit from the start. The second choice is the time horizon. A customer signed this year pays for years, so a first-year ROI understates the return, while a lifetime ROI leans on a retention assumption. Show both, and say which one finance prefers.
Here is how far apart they can sit, using hypothetical figures for Company A over the trailing twelve months. Marketing cost was $13.8 million, covering $9.6 million of programs and $4.2 million of team. Marketing-sourced new ARR that closed in the period was $7.6 million, at a 78% gross margin.
- First-year ROI: $7.6M × 0.78 = $5.93M of gross profit, so ($5.93M − $13.8M) ÷ $13.8M = −57%.
- Four-year ROI, assuming finance's retention data supports an average customer life of four years: $5.93M × 4 = $23.71M, so ($23.71M − $13.8M) ÷ $13.8M = +72%.
Same company, same year, and the answer is either a loss or a healthy return, which is why the definition belongs on the slide in small print.
The attribution vendor Dreamdata's LinkedIn Ads Benchmarks Report 2026, released on March 10, 2026 and drawn from more than 3.5 million customer journeys, measured the full B2B buyer journey at 272 days, up from 211, with 10 stakeholders involved. A quarter is about a third of that, so the revenue that closed in Q3 was mostly started by spend in Q1 or earlier, and a quarterly ROI compares this quarter's cost with last year's work. Use a trailing twelve months instead.
CAC payback period is the efficiency number most boards already track
CAC payback is the number of months a new customer's gross profit takes to repay the sales and marketing cost of winning them. The formula used in the 2026 SaaS & AI Performance Benchmarks report, a vendor benchmark published by Aleph and Benchmarkit, is sales and marketing expense for the prior period, divided by new ARR added times gross margin, times 12.
That report, published June 1, 2026, drew on 342 B2B SaaS and AI-native companies, with 198 of them reporting payback. It found a median of 16 months on 2025 data, down from 18 months in 2024, with the top quartile at 6 months or fewer. Contract size moves it more than anything else: deals under $5,000 a year paid back in a median of 11 months, and $50,000 to $100,000 contracts in 22.
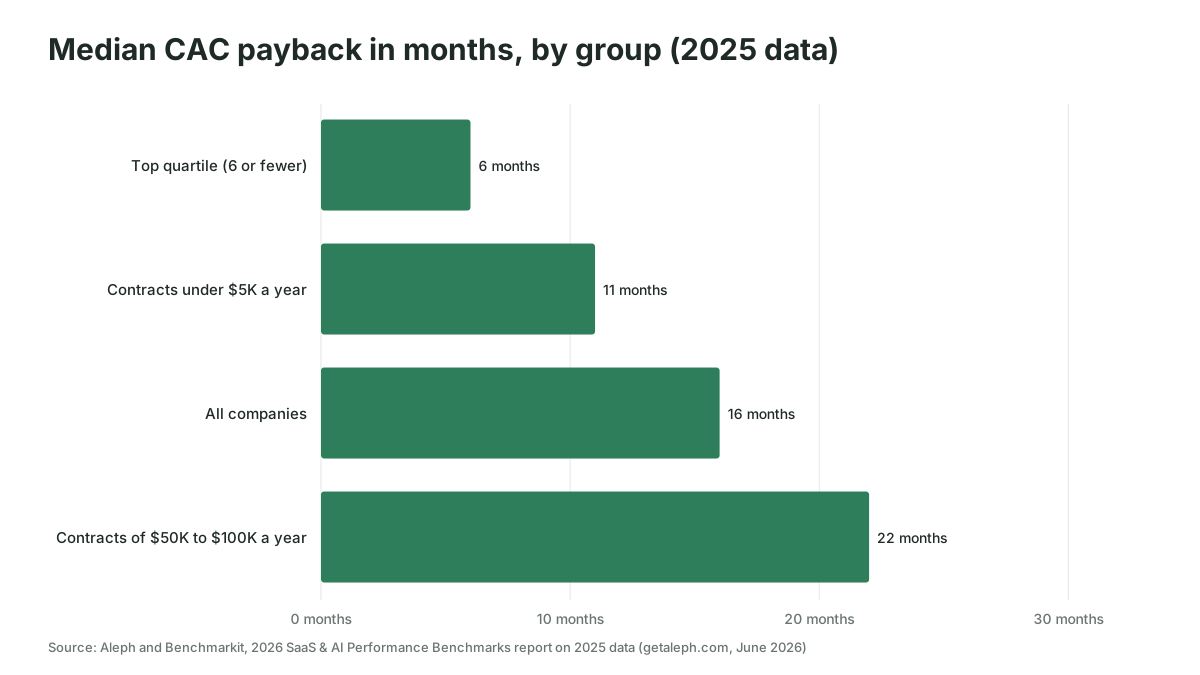
So compare your payback with companies at your contract size: an enterprise seller at 20 months beats its peer median, while a low-ACV seller at 20 months has a problem.
CAC payback is also where AI's effect shows up in finance's own language, because AI touches both sides of the fraction. If AI lets the same team run more programs without new hires, expense grows more slowly than new ARR. If AI improves targeting or qualification, new ARR per dollar rises. Either way, payback falls, and a falling payback is the sentence a board remembers.
Three CFO efficiency ratios move when AI changes cost or conversion
CAC payback is the efficiency number to put on the board slide, but most CFOs also track three related ratios: the SaaS magic number, the CAC ratio and the LTV to CAC ratio. They're marketing efficiency metrics expressed in finance's terms, and AI moves all three through the same two levers as payback: sales and marketing expense, and the new revenue it produces.
| Ratio | Usual formula | What AI changes | What to watch |
|---|---|---|---|
| SaaS magic number | Change in quarterly subscription revenue, times 4, divided by the prior quarter's sales and marketing spend | Expense grows more slowly if AI absorbs work; revenue per dollar rises if targeting and qualification improve | A one-quarter lag, so an AI job shows up a quarter after it starts |
| CAC ratio | Sales and marketing spend divided by new ARR, or the inverse, depending on the finance team | Same two levers as the magic number | Which way up your CFO calculates it |
| LTV to CAC ratio | Customer lifetime value divided by the cost of acquiring that customer | Mostly the CAC side; lifetime value moves only if AI changes who you win | Whether lifetime value is calculated on gross margin |
The magic number came from Scale Venture Partners, which describes it as taking the change in subscription revenue between two quarters, multiplying it by four, and dividing by the sales and marketing spend of the earlier quarter (Scale Venture Partners). Imagine, as a hypothetical, a company whose quarterly revenue rises from $5.0 million to $5.25 million after spending $1.25 million on sales and marketing in the first quarter: $250,000 times four, divided by $1.25 million, gives a magic number of 0.8.
The CAC ratio needs one conversation before it goes in any pack, because finance teams calculate it both ways up. Agree the direction with your CFO and write it in the definitions, or the same quarter can look better or worse depending on who built the slide.
For LTV to CAC, the most quoted guideline comes from David Skok of Matrix Partners, who suggested lifetime value should be more than three times CAC and that months to recover CAC should be under 12 (forEntrepreneurs). He also notes that enterprise businesses with a land and expand model often run nearer 20 months and work fine, so judge your number against your contract size, as with payback above.
Skok makes one more point worth taking to the board: sales efficiency, the magic number and months to recover CAC describe much the same thing. So pick one for the slide, usually CAC payback, and keep the others in the monthly CFO pack. Four efficiency ratios that move together don't tell a board four things.
Pipeline velocity shows whether AI changed the speed of revenue
Pipeline velocity is the value of pipeline that turns into revenue per day, calculated as opportunities times average deal value times win rate, divided by sales cycle length. Salesforce publishes the same formula under the name sales velocity, as "(Opportunities x Deal Value x Win Rate) / Length of Sales Cycle", and defines the cycle as the average time a qualified lead takes to become a paying customer.
Velocity earns its place on a board slide because it splits growth into four levers, and each AI job you fund should push one of them.
| Lever | Example AI jobs | What should move, and when |
|---|---|---|
| Opportunities | Account selection, audience building, creative variation on LinkedIn and Google Ads | Opportunity count from paid programs, within one quarter |
| Average deal value | Targeting a larger ICP tier, account research before outreach | Average opportunity amount at creation, within two quarters |
| Win rate | Lead qualification and routing, sales briefs drawn from ad engagement | Closed-won share of closed opportunities, after one full cycle |
| Sales cycle length | Speed to lead, faster follow-up on high-intent form fills | Median days from opportunity to close, after one full cycle |
The speed and qualification jobs in the last two rows are covered in our guide to AI lead qualification and routing. The point for the board is the timing column: an AI job aimed at win rate cannot show a result in the quarter it launches, and saying so up front buys you the time to prove it.
One caution keeps the number honest. Velocity rises when the cycle shortens, and a cycle can shorten because sales closed out stale deals as lost, which has nothing to do with AI. Report the four components beside the total, so the board can see which lever moved.
Sourced pipeline goes on the slide and influenced pipeline goes in the notes
Sourced pipeline is the value of opportunities where marketing was the agreed origin, under a rule signed off by sales and finance. Influenced pipeline is the value of opportunities where marketing touched the account at any point, which in B2B is nearly all of them.
Sourced pipeline is conservative and auditable, so it carries the headline and feeds marketing ROI. Influenced pipeline shows reach across buying committees, which matters when ten people take part in a decision, but it overlaps with what sales claims, and a board that adds the two together will find that marketing and sales each claim most of the company's revenue.
Platform reports make the overlap worse. Ad platforms, including LinkedIn with its CRM-connected revenue attribution reporting, count pipeline their ads touched, and each platform counts the same deal. Keep those figures as a separate, clearly labeled influenced row, as our guide to building an AI marketing dashboard does, and never sum them into sourced pipeline. For the reasons attribution models disagree in the first place, see AI attribution for B2B.
AI's effect on pipeline needs a grade of proof next to every claim
AI claims reach a board slide in three grades of proof, and the grade should be printed beside each one. Proven means a holdout or incrementality test compared the AI-assisted approach with a control over at least one sales cycle, and the gap was larger than chance would explain. Measured means a before-and-after comparison from system data, such as CRM timestamps or time logs, with other changes written down. Claimed means attribution, platform-reported conversions or a vendor's own figure.
Only proven results go into ROI and payback. Measured results go on the slide as leading indicators with a date by which they become proven or get dropped. Claimed results stay in the appendix, because a platform that runs your bidding and reports your results is marking its own homework.
This is strict, and it is also the only version of the AI line that survives the CFO's question from the opening, because "would we have had them anyway?" is exactly what a holdout answers. If you have never run one, our guide to incrementality testing for B2B covers account holdouts on small audiences. The ROI of the AI set-up itself, its tools, build and review hours, is a separate sum covered in measuring AI marketing ROI; on the board slide it collapses into one cost line beside the pipeline it moved.
A one-page board slide, filled in with hypothetical numbers
The slide below is for a hypothetical B2B SaaS company, Company A, reporting Q3 2026. Every number is invented to show the layout and the arithmetic, and the average deal is $48,000 a year.
Block 1: the four numbers
| Metric | Q3 2026 | Q2 2026 | Change |
|---|---|---|---|
| Marketing-sourced pipeline created | $14.4M (300 opps × $48,000) | $12.9M (280 opps × $46,000) | +12% |
| Pipeline velocity, all open pipeline | $36,960 a day | $30,188 a day | +22% |
| CAC payback, blended | 18.5 months | 20.3 months | 1.8 months faster |
| Marketing ROI, trailing 12 months | −57% first year, +72% over four years | −61% first year, +56% over four years | Improving |
Block 2: how the numbers were calculated
- Velocity Q3: 420 open opportunities × $48,000 × 22% win rate ÷ 120-day cycle = $36,960 a day. Q2: 400 × $46,000 × 21% ÷ 128 days = $30,188 a day.
- Velocity components: opportunities +5%, deal value +4%, win rate +1 point, cycle 8 days shorter.
- CAC payback Q3: $6.0M Q2 sales and marketing expense ÷ ($5.0M Q3 new ARR × 78%) × 12 = 18.5 months. Q2: $5.8M ÷ ($4.4M × 78%) × 12 = 20.3 months.
- ROI Q3: trailing marketing cost $13.8M, marketing-sourced new ARR closed $7.6M, 78% gross margin, four-year customer life from finance's retention data. Q2: $13.2M cost, $6.6M new ARR, same margin and customer life.
Block 3: AI's effect, graded
| AI job | Result | Grade | Status |
|---|---|---|---|
| AI-built LinkedIn target account list, 4,800 accounts against a 1,200-account holdout over six months | 5.2 vs 3.4 opportunities per 100 accounts, +53%, too large a gap to be chance (p < 0.01) | Proven on opportunities | Revenue pending, first closes expected Q1 2027 |
| AI lead routing for demo requests | Median time to first sales touch down from 26 hours to 2, from CRM timestamps | Measured | Win-rate effect judged after one full cycle, Q2 2027 |
| AI bidding on Google Ads | Platform-reported conversions +35% | Claimed | Not counted; holdout planned for Q4 |
| Weekly reporting and list building | 30 team hours a week moved to named work, from time logs | Measured | Capacity, not revenue |
| AI cost in the quarter | $38,000 for tools, usage and build | Actual | Included in marketing cost above |
Block 4: the decision requested
Move $150,000 of Q4 LinkedIn budget into the AI account-selection program and extend its holdout through Q1 2027, when the first revenue result is due.
The 35% conversion figure from the opening is still on the slide, graded and kept out of the totals, which is what makes the rest believable. And the slide ends with a decision, because a board slide that asks for nothing gets read as a status update.
For the budget conversation that follows this slide, our guide to the business case for AI in B2B paid media covers how to put new spend to a CFO.
Report quarterly to the board, monthly to the CFO and weekly in the team
The four numbers go to the board once a quarter, on trailing twelve-month windows wherever revenue is involved. Quarterly suits the board because the long buyer journey makes anything faster mostly noise at board level.
The CFO gets the same four numbers monthly, with the components behind them, so nothing on the board slide is a surprise. The team reviews leading indicators weekly: opportunity creation by channel, speed to lead and cost per opportunity.
When a number is bad, report it on the same slide in the same format. A payback that rose two months, with the reason and the fix, costs you far less credibility than a payback that quietly disappears from the deck the quarter it got worse.
Board reporting on marketing ROI goes wrong in three familiar ways
Most failures come from definitions rather than performance.
- Definitions change between quarters. Sourced pipeline is counted on created date one quarter and on a new attribution rule the next. Write the definitions once, have finance sign them, and print them on the slide.
- AI gets credit for the platforms' own automation. Google, LinkedIn and Meta keep improving their bidding and targeting, which lifts results whether or not your AI jobs did anything. Only a holdout separates the two.
- Leads sneak back in. A board that saw "MQLs up 40%" once will ask for it every quarter. Leave them out from the first slide.
Where to start
This month, agree the definitions of the four numbers with your CFO in a single meeting, then put a grade of proof next to every AI claim in your next board pre-read. If you would like that slide to arrive filled in each quarter, Scalewell builds that kind of reporting with marketing teams, inside the tools they already use.
Frequently asked questions
What is a good B2B marketing ROI?
No credible public benchmark exists for B2B marketing ROI, because companies define it differently: revenue or gross profit, first-year or lifetime, sourced or influenced. A more useful test is direction and payback. A falling CAC payback and a lifetime gross-profit ROI above zero that improves year on year will satisfy most boards better than any single ratio.
What is a good CAC payback period for B2B SaaS?
The Aleph and Benchmarkit 2026 report, covering 2025 data, found a median CAC payback of 16 months, with the top quartile at 6 months or fewer. It depends heavily on contract size: 11 months for contracts under $5,000 a year and 22 months for $50,000 to $100,000. Compare yourself with companies at your deal size.
Should marketing report MQLs to the board?
Boards rarely need MQLs, because MQLs measure marketing activity and boards decide on revenue, efficiency and growth. Keep lead volume in the weekly team review, where a falling lead-to-opportunity rate can warn of a targeting problem early. If the board already expects an MQL number, replace it with sourced opportunities and explain the change once, in writing.
What is the difference between CAC payback and LTV to CAC?
CAC payback measures how many months a new customer takes to repay the cost of winning them, so it is a cash and risk measure. LTV to CAC compares the total gross profit a customer is expected to bring over their life with that cost, so it is a value measure resting on a retention assumption. Boards often want both, with payback as the more conservative one.
Can AI prepare the board report automatically?
AI can pull the CRM and ad platform data, run the formulas, write first-draft commentary and flag numbers that moved unusually, which removes most of the preparation work. The definitions, the grades of proof and the decision requested still need a person, because those are the parts the board is judging. Treat AI's draft as the start of the review, never the final slide.