AI marketing dashboard: how to link B2B ad spend to pipeline and revenue
A spend-to-pipeline dashboard for B2B paid media: the KPIs with formulas and sources, the campaign-key join, a five-row layout with a cohort grid, five build routes, and the jobs AI should and shouldn't do on top.

An AI marketing dashboard for a B2B team is a standing view that joins ad spend from Google, LinkedIn, Meta and Microsoft to opportunities and revenue in the CRM, then uses AI to flag unusual changes, answer questions and write the weekly notes. The numbers come from the joined data. The AI only writes words about them.
You've probably sat through the version that doesn't work. The dashboard has 40 tiles, LinkedIn shows 300 leads at a pleasing cost, and the CFO asks one question: how much pipeline did last quarter's $120,000 create? Someone promises to "pull that together" by Friday, which tells everyone in the room the dashboard can't answer it.
A B2B marketing dashboard answers the pipeline question first
A B2B marketing dashboard earns its place when it answers one question without a meeting: what did paid media spend create in pipeline and revenue, by channel, over a period long enough to mean something. The other B2B marketing metrics on the screen explain that answer.
Most dashboards miss it because the easy data and the important data live in different systems. Spend and platform conversions flow out of the ad accounts in an afternoon, while opportunities and deal amounts sit in Salesforce or HubSpot, keyed to contacts and accounts rather than campaigns. A dashboard built from the easy side looks finished and answers the wrong question very well.
The other problem is time. Dreamdata, an attribution vendor, says in the March 2026 press release for its LinkedIn Ads Benchmarks Report 2026 that the full B2B buyer journey has stretched from 211 days to 272, based on 3.5 million customer journeys from thousands of B2B companies. If journeys run anywhere near that long, a dashboard that puts this month's spend next to this month's pipeline is comparing money with results that mostly belong to spend from two or three quarters ago.
A budget review that runs on pipeline figures from one screen, with AI drafting the weekly notes, leaves the team's time for deciding what to change, and reaching that point is what Scalewell works toward with paid and demand gen teams.
The B2B marketing KPIs to track, with formulas and sources
The B2B marketing KPIs on a spend-to-pipeline dashboard fall into three groups: inputs from the ad platforms, outcomes from the CRM, and ratios that divide one by the other. Each ratio needs both sides measured over the same dates and campaigns, which is why the join in the next section matters more than any tile.
| KPI | Formula | Where the number comes from | Tile or diagnostic |
|---|---|---|---|
| Paid spend vs plan | Spend in period ÷ planned spend | Ad platforms (Google Ads, LinkedIn Campaign Manager, Meta, Microsoft Advertising), plan from finance | Tile |
| Paid-sourced opportunities | Count of opportunities created in period whose source campaign is a paid campaign | CRM opportunity records, campaign field | Tile |
| Cost per opportunity | Paid spend ÷ paid-sourced opportunities | Both, joined on campaign | Tile |
| Pipeline created | Sum of opportunity amount at creation, paid-sourced | CRM | Tile |
| Pipeline per dollar | Pipeline created ÷ paid spend | Both | Tile |
| Win rate, paid-sourced | Closed-won ÷ (closed-won + closed-lost) for paid-sourced opportunities | CRM | Channel table |
| Paid CAC | Paid spend ÷ new customers from paid-sourced opportunities | Both, over a window as long as your sales cycle | Channel table |
| Sales cycle length | Average days from opportunity created to closed-won | CRM | Channel table |
| Pipeline velocity | (Opportunities × average deal value × win rate) ÷ sales cycle length in days | CRM | Trend line |
| ICP share of opportunities | Paid-sourced opportunities at ICP accounts ÷ all paid-sourced opportunities | CRM account fields | Channel table |
| Lead-to-opportunity rate | Paid-sourced opportunities ÷ paid leads | Both | Diagnostic |
| Platform-reported conversions | As reported in each ad account | Ad platforms | Diagnostic only |
Pipeline velocity uses the structure Salesforce publishes, "(Opportunities x Deal Value x Win Rate) / Length of Sales Cycle," and shows whether paid-sourced pipeline is moving faster or slower than last quarter, which a static total hides.
Two rules keep the table honest. Pick one date for opportunities, created or closed, and use it on every tile, since mixing them is how two people end up quoting two pipeline numbers in one meeting. And keep platform conversions and any influenced pipeline figure on their own rows, never added to sourced pipeline, because adding them counts the same deal twice.
Leads stay on the screen as a diagnostic, because a fall in lead-to-opportunity rate can show a campaign drifting outside the ICP weeks before the pipeline tiles do. They don't get a headline tile, since that tile would celebrate the 300 cheap leads from the opening.
The join between ad spend and CRM pipeline runs on a campaign key
The join between ad spend and CRM pipeline is a shared campaign key: the same campaign name or ID recorded on the ad platform's spend row and on the CRM opportunity. Without it, no AI on top can compute the ratios in the KPI table. That join is what makes closed loop reporting possible, with ad spend tied to the pipeline and revenue the CRM records, and it's also the base of closed loop marketing, where those CRM outcomes steer the next round of spend.
In practice, every paid click carries UTM values and, for Google, the click ID, which the CRM stores on the lead and carries onto the opportunity. The utm_campaign value matches the ad account's campaign name or maps to it by convention, and someone owns the list of unmatched campaigns on each side, because a first build usually finds spend with no opportunities attached. Our HubSpot MCP guide walks through that matching for HubSpot deals in detail, and the AI marketing analytics guide covers the click ID capture for Salesforce.
LinkedIn needs one extra decision. Many LinkedIn-influenced deals never carry a LinkedIn click, because the buyer saw the ads, then searched your brand weeks later. LinkedIn's Revenue Attribution Report connects "Salesforce, Dynamics 365, or HubSpot CRM" through Business Manager and reports "revenue won, return on ad spend, and pipeline amount" using impression-based or engagement-based models, with a lookback window of "30, 60, 90, 180, or 365 days". We'd show its pipeline figure as a separate "LinkedIn-influenced" row beside sourced pipeline, and set the lookback to 365 days, the longest LinkedIn offers, because if Dreamdata's 272-day figure is anywhere near your own cycle, even a 180-day window ends before a typical journey does.
Lay the dashboard out in five rows, top to bottom
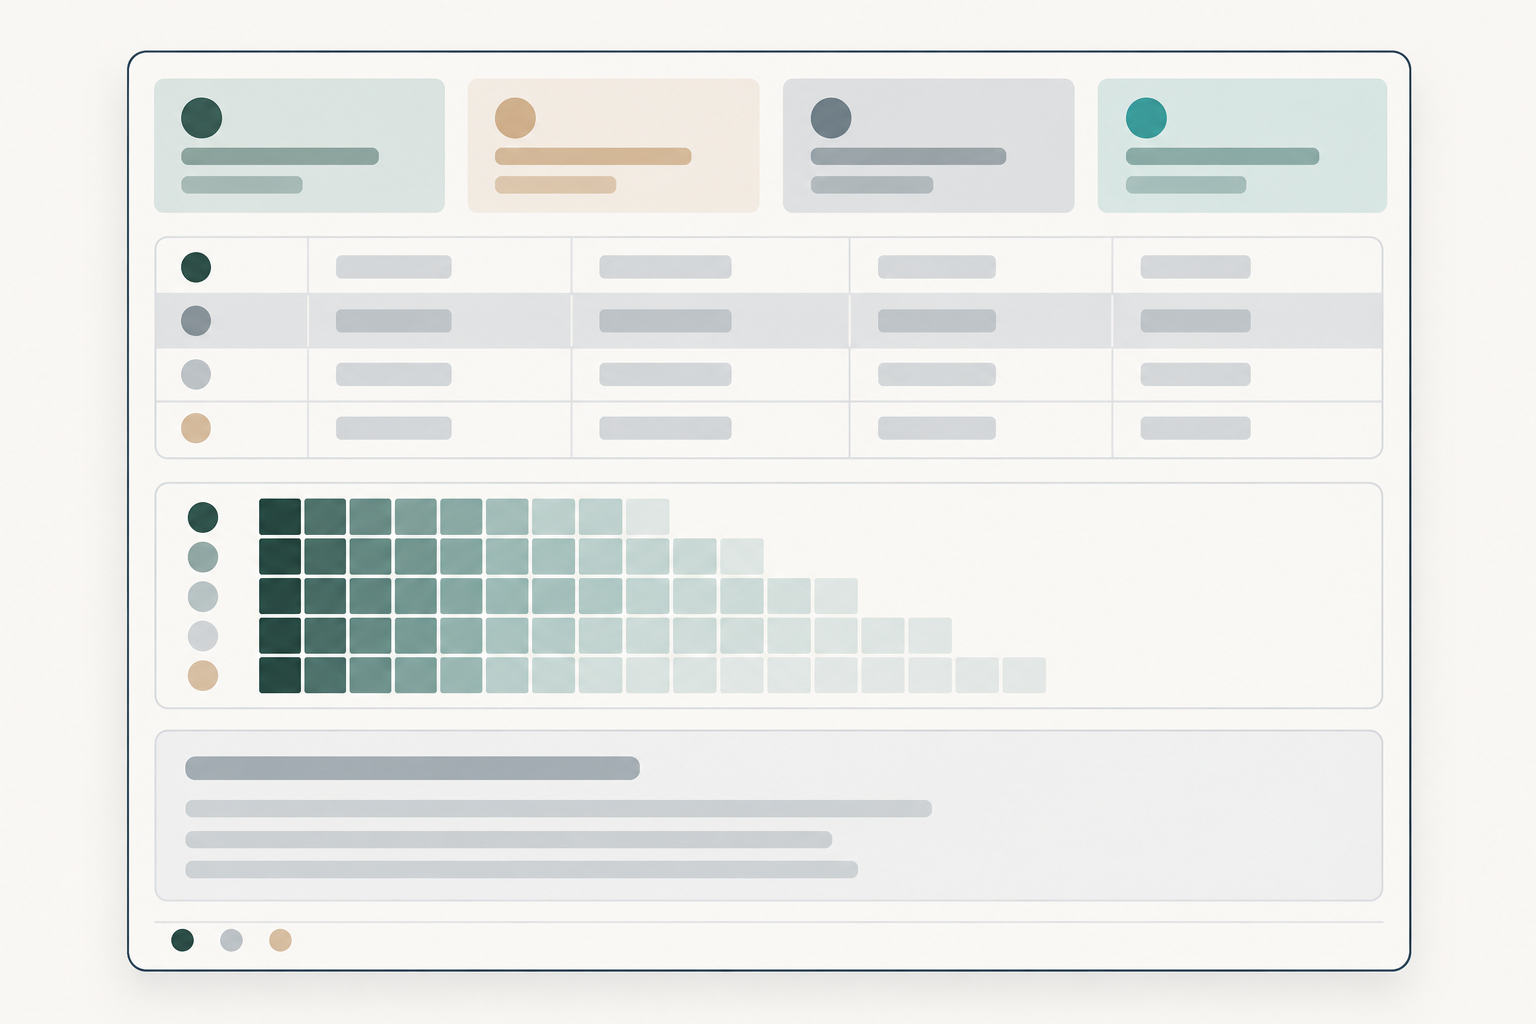
A spend-to-pipeline dashboard works best as five rows that move from the answer to the explanation to the data's health, and the top row of headline tiles works on its own as the CMO dashboard.
- Headline tiles. Paid spend against plan, pipeline created, cost per opportunity and pipeline per dollar, each for the trailing 90 days beside the prior 90, because a single month of B2B opportunities is too few to read.
- Channel table. One row per channel (Google Ads, LinkedIn, Meta, Microsoft Advertising) with spend, paid-sourced opportunities, cost per opportunity, pipeline, win rate, paid CAC and ICP share. The LinkedIn-influenced pipeline row sits directly under LinkedIn, in grey, so nobody adds it in.
- Cohort grid. Rows are spend months; columns are months since that spend (month 0, 1, 2 and so on); each cell is cumulative pipeline from opportunities linked to that month's campaigns. This panel handles long journeys: it compares January's spend with January's eventual pipeline rather than whatever arrived in January.
- AI notes. A text panel with this week's anomaly notes and a short written summary, each line pointing to the tile or cell it describes.
- Data health strip. Last refresh time for each source, the share of opportunities with a campaign value, and the count of unmatched campaigns. When the share drops, every tile above it is less true, and the strip says so before someone quotes it.
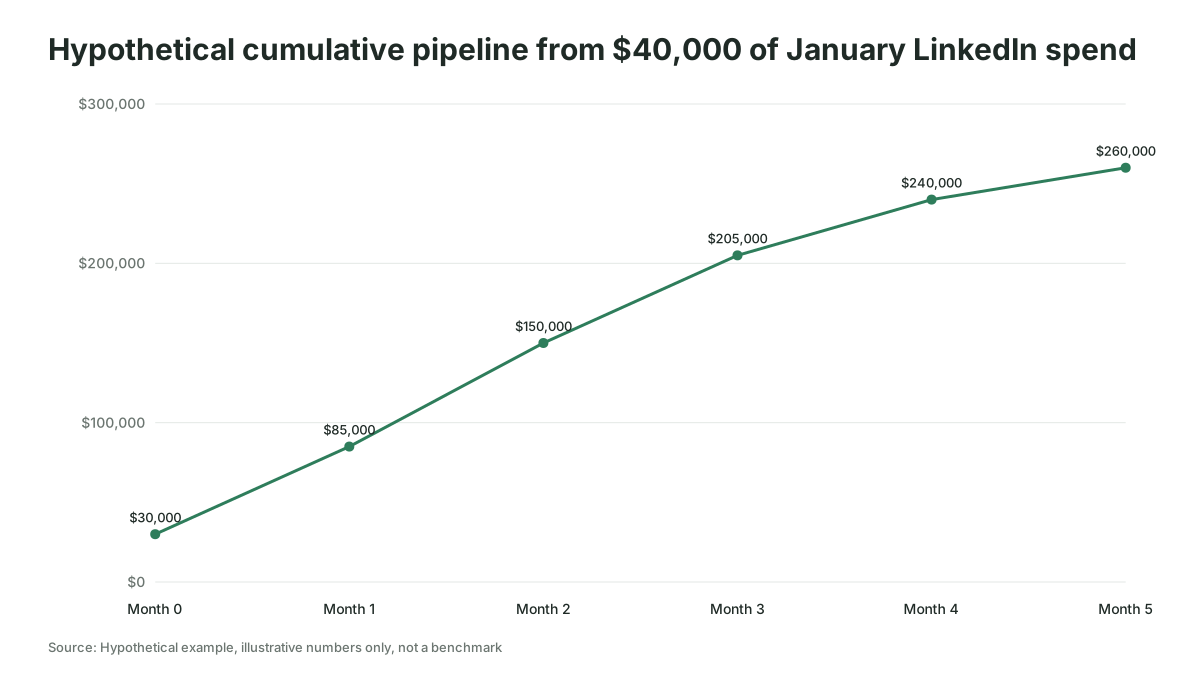
Here's how the grid reads for a hypothetical team (the figures are invented for illustration) that spent $40,000 on LinkedIn in January. Pipeline linked to that spend is $30,000 by the end of January, $85,000 by the end of February and $260,000 by the end of June. A dashboard that judged January in February would have reported pipeline per dollar of about 2.1. By June it is 6.5, three times the February reading, from the same spend.
Five routes build an AI marketing analytics dashboard, as of November 2026
An AI marketing analytics dashboard can be built five ways as of November 2026, and the right one is the route closest to wherever spend and pipeline already meet. We recommend none over the others; each was checked against the vendor's documentation this month. For tools sorted by every paid media job beyond reporting, see our survey of AI tools for B2B paid media.
| Route | Examples checked November 2026 | What it covers | AI on top | Fits when |
|---|---|---|---|---|
| CRM-native ads reporting | HubSpot ads tool (Marketing > Ads > Analyze) | Spend from Facebook, Google and LinkedIn Ads synced into HubSpot, with contacts, closed-won deals, revenue and ROI attributed by HubSpot | Whatever the CRM's own assistant offers | You run HubSpot and want a first version this month |
| BI tool with AI features, fed by a connector | Power BI with Copilot; Data Studio (formerly Looker Studio); Tableau Pulse; connectors such as Supermetrics or Fivetran | Whatever the connector loads, joined in the BI model | Questions, summaries, anomaly notes | A BI tool already exists and someone can model the join |
| Warehouse plus semantic layer plus a model | BigQuery Data Transfer Service or a connector into BigQuery or Snowflake, definitions in a semantic layer, a model reading them | Everything, under definitions you write once | Questions and narrative grounded in the defined metrics | You have a data person and several sources |
| B2B revenue attribution platform | Dreamdata, HockeyStack and similar | The vendor's joined, account-based copy of ad and CRM data | Built-in analytics agents | You'd rather rent the join than build it |
| AI client with connectors | Claude or ChatGPT reading ad platforms and the CRM through MCP servers | One source per connector, joined in the conversation | The client itself | Ad hoc questions while the standing dashboard is built |
A few facts the table can't hold:
- HubSpot. The ads analysis page reports "Amount Spent", "Total Contacts", closed-won deals, "Revenue from deals" and ROI, and says that by default all reports use a "Last ad interaction" model. Some additional metrics need Marketing Hub Professional or Enterprise. Microsoft Advertising isn't among the networks the page names.
- Power BI. Copilot needs a paid Fabric capacity of F2 or higher or Power BI Premium P1 or higher; a Pro or Premium Per User license alone isn't enough. It can create report pages, add a narrative visual and put summaries into report subscriptions.
- Data Studio. Google renamed Looker Studio back to Data Studio on April 11, 2026, in a free edition and a paid Data Studio Pro. Its Conversational Analytics is available to all Data Studio users in its new form, which works on BigQuery data agents, and is still in preview.
- Tableau. Pulse "starts by using standardized, deterministic statistical models to detect facts about metrics," then writes summaries "grounded in statistical truths". Summaries appear only when an admin turns on AI in Tableau and you follow two or more metrics.
- Warehouse. BigQuery's Data Transfer Service lists Google Ads, Facebook Ads and Salesforce as sources, with HubSpot in preview. LinkedIn and Microsoft Advertising aren't listed, so those two arrive through a connector service or their APIs.
- Connectors. Supermetrics sends LinkedIn Ads data to warehouses such as BigQuery and Snowflake and to Power BI.
- Dreamdata. Dreamdata AI, launched in September 2026, adds an Analytics Agent, an MCP server for Claude and ChatGPT, and a data warehouse.
The decision rule follows the last column. A HubSpot team with no Microsoft Ads can start in the ads tool and accept last ad interaction for now; when nobody will own a data model, rent the join. The AI client route gives leadership no standing screen, so treat it as the bridge while one of the others is built.
AI writes the notes and answers questions, and the numbers stay computed
AI earns three jobs on a spend-to-pipeline dashboard: writing anomaly notes, answering questions in plain language, and drafting the weekly narrative. It never calculates a headline number on its own, and the vendors say why.
Google's Conversational Analytics page warns that Gemini for Google Cloud products "can generate output that seems plausible but is factually incorrect." Microsoft's Copilot page says that without a prepared model, "Copilot can misinterpret the data and return generic or inaccurate results." Dreamdata's CEO Nick Turner put the design choice plainly: "A governed semantic layer means that Dreamdata AI never recalculates the numbers itself so it cannot misrepresent the truth."
So each job gets a rule:
- Anomaly notes cite the tile and the size of the change, for example (an invented note) "LinkedIn cost per opportunity up 38% on the trailing 90 days," and are generated by statistics, then phrased by the model.
- Questions run against the defined metrics, never raw exports. Keep a set of questions with known answers (15 to 20 is a workable size) and rerun them after every change to the model.
- The weekly narrative reads the finished tiles and the cohort grid, and a named person signs it before it goes to leadership.
And one thing AI should never do on this dashboard: forecast the pipeline effect of moving budget between channels from last quarter's correlations. That question needs a test or a model, which the AI attribution guide covers.
Building the dashboard takes six steps
Building a spend-to-pipeline dashboard takes six steps, and the first two are usually the slow ones.
- Write the definitions. One page: what counts as a paid-sourced opportunity, which date it belongs to, the currency, and how a deal with several campaigns is credited, signed off by sales ops and finance.
- Fix the campaign key. Export live campaign names from each ad account and the distinct campaign values on recent opportunities, and fix the mismatches. You finish with an unmatched list short enough to own.
- Connect the sources. Load spend from each platform and opportunities from the CRM into the route you chose, and for LinkedIn connect the CRM in Business Manager (LinkedIn says this needs Business Manager admin access and up to 72 hours before data appears). You finish with every source refreshing on a schedule.
- Build the five rows. Start with the data health strip, then the tiles, then the channel table and cohort grid. You finish with tiles whose totals match the CRM and finance's spend figure to the dollar.
- Add the AI layer. Turn on the anomaly and summary features your tool offers, point them at the defined metrics, and load the test questions. You finish with an accuracy score.
- Run it for a month beside the old report. You finish when leadership has used the new screen for one budget decision.
A spend-to-pipeline dashboard goes wrong in three ways
Most of these failures are data problems that look like AI problems.
- Too few opportunities per tile. A handful of opportunities makes cost per opportunity swing from one week to the next. Our rule of thumb, not a benchmark: below about ten paid-sourced opportunities in 90 days, show that channel quarterly or group it with others, rather than letting an anomaly note fire every Monday.
- A falling match rate nobody sees. A new landing page drops the UTM parameters and pipeline per dollar falls for reasons that have nothing to do with the ads, which is what the health strip is there to catch.
- AI notes about last week's pipeline. Last week's B2B opportunities are still arriving, so point the notes at the trailing 90 days and the cohort grid.
Our advice if your CRM records a campaign on fewer than half of new opportunities is to wait: fix capture first and use the platforms' own reports meanwhile, because a dashboard built on a third of the deals is precise about the wrong total.
How Scalewell gets a spend-to-pipeline dashboard running in a team's week
Scalewell's work here aims at a team that opens one screen on Monday and sees what paid media created in pipeline. After a free 30-minute call, an audit of the team's week turns its recurring jobs into a ranked roadmap, with AI's first job at the top. A build sprint, typically 8 to 12 weeks and sometimes longer, builds the first jobs in the tools the team already uses. When it finishes, AI handles real jobs every week, the next ones are ranked, and trained people can use and change what was built without Scalewell. B2B paid media practitioners do the work, and time saved and pipeline are the measures for every job.
The dashboard is working when a budget decision runs on it
You can tell the dashboard is working by three checks. The headline tiles match the CRM and finance's spend figures to the dollar for four weeks running. The share of opportunities with a campaign value holds above a floor you set on the health strip; we'd suggest 80% as a starting target, not an industry benchmark. And at least one budget decision in the quarter, such as moving money between two LinkedIn campaigns, was made on cost per opportunity or the cohort grid rather than on leads.
That last check is the one to report upward. If you want to count the hours the dashboard saves as well, the guide to measuring AI marketing ROI explains which of those hours belong in the sum.
Where to start
Write the one-page definitions glossary this week and count how many of last quarter's opportunities carry a campaign value; that number tells you whether you're ready to build or need to fix capture first. If you'd like help getting the dashboard and the AI notes running as part of the team's week, Scalewell does that work alongside paid and demand gen teams.
Frequently asked questions
Can ChatGPT or Claude build a marketing dashboard?
They can help build one by writing the SQL or DAX for each KPI and drafting the layout. What they don't give you is a standing screen that refreshes for leadership every morning; that still needs a BI tool, a CRM report or an attribution platform holding the joined data.
How often should a marketing dashboard refresh?
Daily is enough for a spend-to-pipeline dashboard. Spend changes hourly, but opportunities and deal amounts in the CRM change slowly, so refreshing more often adds cost and noise without changing any decision you'd make that day.
What is the difference between a marketing dashboard and a marketing report?
A dashboard is a standing screen anyone can open, showing current figures with no commentary beyond automated notes. A report covers one fixed period, explains what changed and what the team did, and carries a person's name. Most B2B teams need both, and the report draws its figures from the dashboard, as our guide to the weekly PPC report sets out.
Do I need a data warehouse for an AI marketing dashboard?
You don't need one to start. A HubSpot team can build a first version in its ads tool, and a team with a BI tool can join two or three sources through a connector. In our view a warehouse becomes worth it once you run several ad platforms plus a CRM, because the definitions then need one home every tool reads from.