Revenue marketing: how to run paid and demand gen on pipeline, with AI doing the measurement work
Revenue marketing means running paid and demand gen on CRM pipeline rather than platform conversions, and this guide gives the leader a six-number scorecard, a weekly to quarterly meeting rhythm and the five measurement jobs AI can now carry.

Revenue marketing means running marketing against the pipeline and revenue it creates in your CRM, rather than the leads it collects or the conversions ad platforms report. For a paid and demand gen team, that means targets, budget moves and creative calls are set on opportunities and pipeline value, with AI doing the daily matching.
Picture the monthly review. LinkedIn Campaign Manager says the quarter produced 150 conversions, Google Ads claims 80 more, and the CRM shows 16 new opportunities with a paid touch. Everyone in the room knows which number the CFO will ask about. Nobody can say which campaigns made those 16, because the matching takes a week of exports and the review is tomorrow.
Running a team on that smaller, harder number changes how a marketing leader spends the week. It covers the scorecard, the meeting rhythm and the decisions that change, and which parts of the measurement AI can now carry. Weekly budget calls made on pipeline are what Scalewell helps paid and demand gen teams get to, and the hard job underneath is getting every platform conversion matched to a CRM record in time for that call.
Revenue marketing runs paid and demand gen on CRM pipeline
Revenue marketing, sometimes called pipeline marketing, is a way of running the marketing team where the targets, budgets and reviews all point at opportunities and closed revenue recorded in the CRM. Lead counts and platform conversions still exist, but they become inputs the team uses to steer, never the number it is judged on.
The term is looser than it sounds. The Marketing Accountability Standards Board's Universal Marketing Dictionary says it "is used in such a variety of ways that it is difficult to identify a common conceptual core definition." Vendors fill the gap with their own versions, so it helps to pin down what it means for the people who spend the paid budget.
For a paid and demand gen team, we'd define it by three habits. Every channel has a pipeline target, set before the quarter starts. Budget moves between channels and campaigns are argued with cost per opportunity and pipeline per dollar, not cost per lead. And the platforms' own conversion numbers are used to manage bidding and delivery inside each platform, never to compare one platform with another.
That last habit is the one most teams skip, and it's where the trouble starts.
Platform conversions overstate paid media for three reasons
Ad platform conversion counts overstate what paid media produced, because each platform counts on its own terms, counts actions that are not pipeline, and stops counting long before a B2B deal is decided. Each reason pushes the platform number away from the CRM number in a different way.
Each platform claims credit inside its own window. As of November 2026, Google Ads sets new conversion actions to a 30-day click and 1-day view window by default. LinkedIn's Campaign Manager defaults to a 90-day click and 90-day view window and uses last-touch attribution for most conversion types. A buyer who clicks a search ad and later scrolls past a LinkedIn ad can be counted once by each platform. Add the platform totals together and you get a figure that no CRM will ever match.
Platforms count actions, and actions are cheap. LinkedIn's own blog says "the average LinkedIn Lead Gen Form conversion rate is 13%", against a 4.02% Unbounce landing page average (LinkedIn). That is a rate of form fills, not pipeline, and a form that converts three times as often can still produce fewer opportunities per dollar.
B2B journeys outlast every window. Dreamdata's March 10, 2026 benchmark release puts the full B2B buyer journey at 272 days, up from 211, with buyers spending "the first 220 days" forming decisions before they enter a sales pipeline. Even LinkedIn's 90-day default covers about a third of that journey, and our AI attribution guide covers what that gap does to credit splitting.
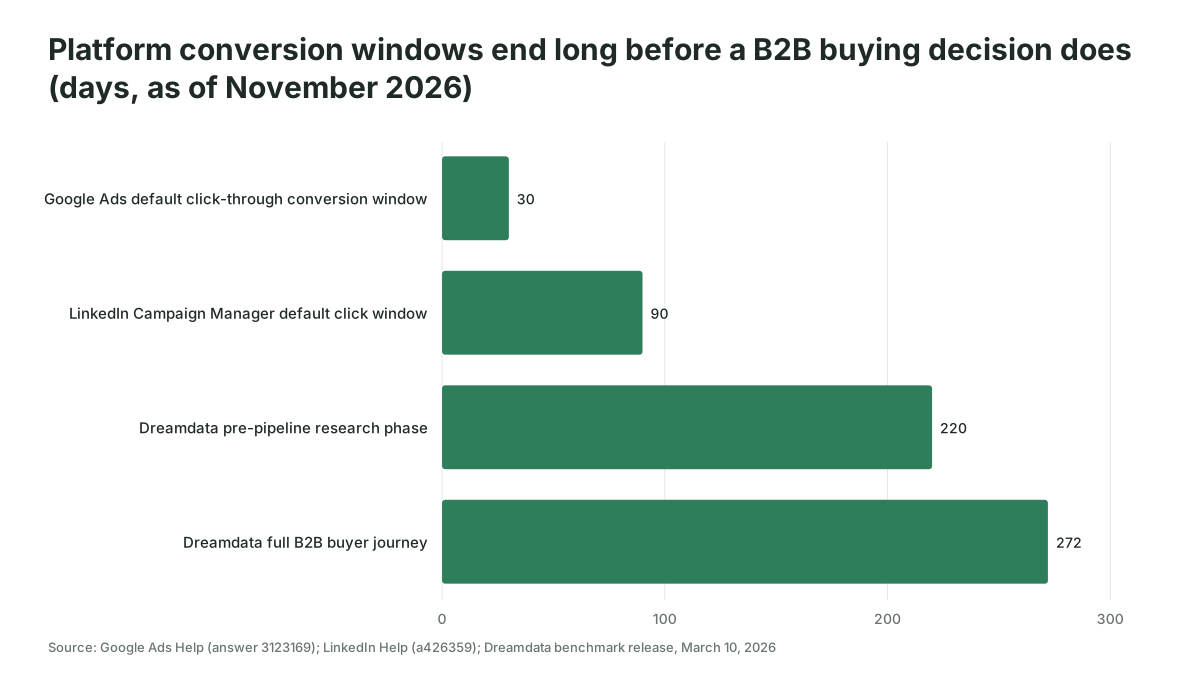
So what does this change for you? It means the platform number answers "did the auction work?" and the CRM number answers "did the money work?" You need both, and you can only run the team on the second.
Six numbers to run paid and demand gen on
A revenue marketing scorecard for a paid team needs six numbers: two that judge spend, two that steer it while pipeline matures, one that checks the data and one that tests cause. Each one has a formula, a source and a decision it drives, and if a number drives no decision it doesn't belong on the sheet.
| Number | Formula | Source | Reviewed | Decision it drives |
|---|---|---|---|---|
| Cost per opportunity | Channel spend divided by opportunities with a touch from that channel, in the cohort | Ad platforms plus CRM | Monthly | Budget between channels and campaigns |
| Pipeline per dollar | Pipeline value created divided by spend, same cohort | CRM | Monthly and quarterly | Channel mix and next quarter's plan |
| Lead to opportunity rate | Opportunities divided by leads, per campaign and offer | CRM | Weekly read, monthly decision | Which offers, forms and audiences to keep |
| Days from first touch to opportunity | Median days, per channel | CRM | Quarterly | How long to wait before judging a channel |
| Match rate | Share of platform-reported conversions found as CRM records | Ad platforms plus CRM | Weekly | Whether the other numbers can be trusted yet |
| Incremental pipeline | Pipeline in exposed accounts minus pipeline in a holdout | CRM plus a test design | Twice a year per major channel | Whether a channel causes pipeline or only collects credit |
Two notes on the table. Cost per opportunity and pipeline per dollar are read by cohort, meaning the spend in a given month against the opportunities that month's touches later produced, because a quarter's spend keeps creating pipeline for months. And the median days figure tells you how long a cohort needs before it counts as mature.
Match rate is the dull one, and it's the one that saves you from a bad decision. If only half of LinkedIn's reported leads exist in the CRM, any cost per opportunity you calculate for LinkedIn is built on half the story. Our AI marketing dashboard guide covers how to join campaign keys to CRM records so these numbers can sit on one screen.
Hypothetical: two teams read the same quarter
Imagine two hypothetical B2B software companies with identical results. Each spent $60,000 on LinkedIn and $40,000 on Google Search in a quarter. LinkedIn reported 150 conversions, which is $400 each, and Google reported 80, which is $500 each.
In the CRM, LinkedIn touched 6 new opportunities averaging $40,000 and Google touched 10 averaging $30,000. That puts LinkedIn at $10,000 per opportunity and $4 of pipeline per dollar ($240,000 on $60,000), and Google at $4,000 per opportunity and $7.50 per dollar ($300,000 on $40,000).
Company A sees the second set of numbers and moves $20,000 from LinkedIn to Google for the next quarter. It has at least stopped trusting the $400 figure, which is progress.
Company B checks the median days from first touch to opportunity first. Say its LinkedIn opportunities show up a median of 120 days after first touch while its search opportunities show up within 30 days. Then most of this quarter's LinkedIn cohort hasn't had time to become pipeline yet. So Company B holds LinkedIn flat, books the comparison for 120 days after the quarter's last day, and compares the two channels again then. If LinkedIn still sits at more than twice Google's cost per opportunity at that point, the money moves.
Both teams had the same data and made different decisions, and the difference was one number on the scorecard and the discipline to wait for it.
The weekly, monthly and quarterly meetings each get one job
Running paid and demand gen on pipeline changes what each recurring meeting is for: the weekly meeting manages delivery and data health, the monthly meeting moves budget on cohorts, and the quarterly meeting sets targets and tests cause. Mixing those jobs is how a team ends up cutting a channel on a week of platform data.
| Meeting | What it reviews | Decisions made there | What AI prepares beforehand |
|---|---|---|---|
| Weekly | Pacing, platform conversions, lead to opportunity rate, match rate | Bids, creative swaps, broken tracking, offer fixes | Pacing check, match rate by platform, list of leads with no CRM record, anomalies with a short explanation |
| Monthly | Cost per opportunity and pipeline per dollar for mature cohorts | Budget between campaigns and channels | Refreshed cohort table, a draft narrative of what changed and why |
| Quarterly | Pipeline per dollar trend, days to opportunity, incremental pipeline | Channel targets, holdout tests, next quarter's plan | Cohort trends, holdout sizing and readouts, the first draft of the plan |
The weekly meeting is where platform numbers still earn their place. Google's Smart Bidding and LinkedIn's automated bidding learn from whatever conversions you send them, so the team watches those numbers to keep delivery healthy. The work that matters most here is feeding the platforms better conversions: our offline conversion tracking guide shows how to send opportunity stages back to Google Ads, Microsoft Advertising and LinkedIn.
The quarterly meeting is where the story for the board gets built, and our guide to reporting marketing ROI to the board covers how to present it upward. The holdout tests that feed the incremental pipeline line are covered in our incrementality testing guide.
AI takes on five measurement jobs that used to stall pipeline reporting
The reason most teams never get to a pipeline scorecard is the labor: matching platform data to CRM records, chasing broken tracking and rebuilding cohort tables by hand. AI now does that reading, matching and drafting well enough to hand it the routine part, while people keep the definitions and the decisions.
- Match every platform conversion to a CRM record. A model reads the day's leads from each platform and finds them in the CRM by email, click ID or campaign key, then lists the ones it can't place. That list is the match rate, produced daily instead of at quarter end.
- Check every offline conversion send. Google Ads won't import an offline conversion uploaded more than 90 days after the associated click, or 63 days for enhanced conversions for leads. A daily AI check compares what the CRM sent with what each platform accepted and flags rejections before they age out. In Google Ads the accepted side is on the Conversion summary page: hover over the offline action's data quality rating and select "Go to diagnostics".
- Rebuild the cohort table. Each week the model refreshes cost per opportunity and pipeline per dollar by monthly cohort and marks which cohorts are mature enough to judge.
- Explain the anomalies. When the match rate drops or a campaign's lead to opportunity rate halves, the model drafts a short explanation from the data it can see, such as a changed form, a new audience or a broken UTM parameter, for a person to confirm.
- Draft the readouts. Before the monthly and quarterly meetings, the model writes the first version of what changed and why, with every figure taken from the computed table, never from the model's own arithmetic.
Some of the plumbing already ships inside the tools. HubSpot can sync lifecycle stage changes to Microsoft Advertising as conversion events (in HubSpot, go to Marketing, then Ads, click Create, choose Conversion event and pick "Sync lifecycle stage changes"), per its help article updated October 4, 2026. LinkedIn lets you create Conversions API, CSV and CRM-synced conversions from the Conversion Tracking page in Campaign Manager, which sits under Measure in the left menu.
What stays with people is everything that needs judgment. Someone senior decides what counts as an opportunity, and that definition has to be agreed with sales, which our sales and marketing alignment guide covers. A person makes every budget call. And a person signs off the narrative before it reaches the CFO, because a fluent paragraph with one wrong cohort in it is worse than no paragraph.
Pipeline targets go wrong in four predictable ways
Most failed moves to pipeline targets fail on timing, volume or definitions rather than on the idea itself. These four are worth naming before you start.
Judging a channel before its cohort is mature. A new LinkedIn program judged on its first month of opportunities will almost always look expensive, because the cohort hasn't had time to convert. Set the judging date from your own median days to opportunity, and write it down before launch.
Asking the platforms to bid on numbers too small to learn from. Sending opportunities to the platforms as conversions is right, but a campaign with single-digit opportunities a month gives the bidding algorithm very little to work with. In that case we'd send a stage with more volume, such as sales-accepted leads, for bidding, and keep opportunities for judging.
Letting the opportunity definition drift. Once marketing is measured on opportunities, there's quiet pressure to create more of them. If opportunities created rises while the win rate falls, check the definition before celebrating. Pipeline you can't close is just a more expensive kind of lead.
Turning the paid team into a data team. If your specialists spend Mondays reconciling exports, you've moved the work rather than removed it. The point of handing measurement to AI is that the team's hours go to the decisions the scorecard now supports, and a scorecard nobody has time to read is a very tidy waste of effort.
How Scalewell gets pipeline numbers into your weekly budget call
Scalewell's aim is a paid team that walks into every budget meeting with cost per opportunity already matched, checked and explained. The first conversation is a free 30-minute call. The audit of your team's week follows and carries most of the weight: it lists each recurring job around measurement, from lead matching to offline conversion checks and cohort refreshes, notes which systems and data feed it, and puts the jobs in the order AI should take them. That score becomes a ranked roadmap. The build sprint after that, typically 8 to 12 weeks, sets up the first jobs inside your existing CRM, ad platforms and reporting tools. From then on, the measurement jobs belong to your team.
Where to start
This week, pull last quarter's paid leads from LinkedIn and Google Ads and count how many you can find in the CRM. That one match rate tells you whether you're ready to judge channels on pipeline or need to fix the data first. If a closer look at where your team's measurement hours go seems like the next step, a free call with Scalewell is a low-stakes way to test it.
Frequently asked questions
Is revenue marketing the same as RevOps?
RevOps and revenue marketing are different things: RevOps is an operations function that runs the systems, data and processes shared by marketing, sales and customer success. Revenue marketing is a way of running the marketing team itself, with targets and budget decisions set on pipeline. A marketing team can practice revenue marketing with or without a RevOps team, though shared CRM definitions make it much easier.
What does a revenue marketing manager do?
A revenue marketing manager plans and runs campaigns against a pipeline target instead of a lead target. In practice that means owning the link between campaign spend and CRM opportunities, reviewing cost per opportunity by channel, and working with sales on stage definitions. In smaller teams the head of demand gen usually covers the role.
Should we still report MQLs?
Keep MQLs as an internal steering number, since they arrive weeks or months before opportunities and show whether campaigns are reaching the right people. Stop reporting them upward as the result. Leadership should see opportunities and pipeline value, with lead volume shown only to explain a change in those.
How do you set pipeline targets for paid media?
Work backward from the revenue target. As a hypothetical, a $2 million new revenue goal with a $50,000 average deal needs 40 wins. At a 20% win rate that means 200 opportunities. If marketing is expected to source 60% of them, its target is 120 opportunities, which you then split by channel using last year's cost per opportunity.
Can a small B2B team run revenue marketing without expensive software?
Yes, if the CRM records where each contact came from. A shared spreadsheet that joins monthly ad spend to opportunities by campaign name is enough to calculate cost per opportunity and pipeline per dollar. The constraint is usually discipline with UTM parameters and campaign naming, not tooling, and AI can check both daily.