A PPC report template, plus the AI workflow that fills it
A copyable five-section PPC report template that puts pipeline next to spend, stamps the data freshness Google's own lag demands, and comes with the prompt and export steps to draft it with AI each week.

A PPC report template is a fixed, one-page document with five sections: a summary, spend against plan, pipeline outcomes from the CRM, the changes you made, and the next actions. Every row carries the period, a comparison and a source. The full template is below as tables, ungated, with the weekly AI workflow that fills it in about an hour.
You probably know the Monday version of this. The dashboard is live, the numbers are green, and someone from finance still writes to ask what last week's $14,000 bought. The report that should answer that question in one line instead needs a call, two tabs and a spreadsheet nobody can find.
This article is for the person who runs the accounts and owns that Monday. It gives you the template, a rule for what earns a row in it, the data-freshness stamp that most templates skip, and a prompt you can paste into Claude, ChatGPT or Gemini to draft the narrative from your own exports. If you want the automation side, with scheduled pulls and a report that assembles itself, read Automating weekly PPC reporting with AI next.
Most PPC report templates are dashboards wearing a cover page
Most published PPC report templates are collections of platform metrics arranged by channel, and that is the reason they rarely get read past the first page. We opened the top-ranking templates for this search before writing ours. AgencyAnalytics' version runs to 14 sections, with one each for Google, Facebook, Bing, Instagram, Reddit, TikTok and LinkedIn before it reaches goals and next steps. Swydo's template leads with ROAS and cost per acquisition and then works through core metrics, campaign analysis, audience and budget. Rows lists eight spreadsheet templates, split by platform. They are all competent, and they all answer the question "what happened on each platform" when the person reading the report asked "what did the money do."
The template below is built the other way round. It starts from the question the budget owner asks, puts the pipeline number next to the spend number on the same page, and treats the platform detail as an appendix you attach when someone wants it.
One rule decides what goes in: a metric earns a row only if a change would follow when it moves. Cost per opportunity moving 30% changes next week's budget split, so it stays. Impressions moving 30% changes nothing on their own, so they go to the appendix. The test sounds obvious, and applied to the templates above it would move most of the per-platform rows into the appendix. Applying that rule is where AI earns its keep, filling the page from your own data each week, and Scalewell takes this on with paid teams so the budget owner reads only what matters.
The template has five sections and runs to one page
The five sections, in order, are the summary, spend against plan, pipeline outcomes, changes made and next actions. The order is deliberate: the reader should be able to stop after any section and still have been told the most important thing left. Each section below is a table you can copy into a document or spreadsheet. The header block comes first.
Header block
| Field | What goes here |
|---|---|
| Account or program | The brand and the channels covered, for example "Acme, Google Search + LinkedIn" |
| Period | Exact dates, Monday to Sunday for a weekly report |
| Comparison | The previous period and the same period last year where you have it |
| Data pulled at | Date and time of the export, with the time zone |
| Freshness note | Which figures are still provisional and why (see the freshness section below) |
| Owner | The person who signs the report, which is a human even when AI drafted it |
Section 1 is a four-line summary
The summary states the outcome, the cost of the outcome, the one thing that moved and the one decision that follows, in four lines a CFO can read on a phone. Write it last and put it first.
| Line | Content | Example (hypothetical) |
|---|---|---|
| Outcome | Pipeline created from paid this period, in the CRM's own terms | 14 opportunities, $212,000 pipeline |
| Cost of outcome | Spend and cost per opportunity, against target | $38,400 spent, $2,743 per opportunity against a $3,000 target |
| What moved | The single largest change in a number that matters, with its likely cause | Cost per opportunity on LinkedIn fell 22% after pausing the two awareness campaigns |
| Decision | What you are doing about it, or asking for | Moving $4,000 of next week's Google Display budget to LinkedIn lead gen |
Section 2 compares spend against plan, by channel
Spend against plan shows what you planned to spend, what you spent, the variance and the reason, per channel and in total. The reason column is the part people skip and the part finance reads first.
| Channel | Planned spend | Actual spend | Variance | Pacing to month end | Reason for variance |
|---|---|---|---|---|---|
| Google Search | |||||
| Google Performance Max or Display | |||||
| Meta | |||||
| Microsoft Advertising | |||||
| Total |
Here is the same table filled in for the hypothetical week summarized in section 1. That account runs Google Search, Google Display and LinkedIn only, so the Meta and Microsoft Advertising rows are dropped.
| Channel | Planned spend | Actual spend | Variance | Pacing to month end | Reason for variance |
|---|---|---|---|---|---|
| Google Search | $18,000 | $18,900 | +$900 (+5.0%) | 102% of monthly plan | Google overdelivery on two campaigns, inside monthly cap |
| Google Display | $6,000 | $5,700 | -$300 (-5.0%) | 96% of monthly plan | 40 low-quality placements excluded on Thursday |
| $15,000 | $13,800 | -$1,200 (-8.0%) | 93% of monthly plan | Two awareness campaigns paused the week before | |
| Total | $39,000 | $38,400 | -$600 (-1.5%) | 98% of monthly plan | LinkedIn pause, partly offset by Search overdelivery |
Two notes on filling it. First, "planned" means the media plan figure for the period, so if your plan lives in a spreadsheet, link it here. Second, Google's own spending rules will produce variances you did not cause. Google states that for most campaigns the daily spending limit is the average daily budget multiplied by two, and the monthly spending limit is 30.4 times the average daily budget, so a campaign can legitimately run 40% over its daily budget on a Tuesday and still land on plan for the month. Write "Google overdelivery, inside monthly cap" rather than "overspend" when that is what happened. For the weekly checks that catch real overspend early, see Automating PPC budget pacing checks with AI.
Section 3 reports pipeline outcomes from the CRM, then platform conversions
Pipeline outcomes are the leads, qualified leads, opportunities and pipeline value that this period's spend created, taken from the CRM, with the platform's own conversion count shown alongside for reconciliation. The CRM column is the one you report on. The platform column is there so you can see the gap and explain it.
| Channel | Platform conversions | CRM leads | Qualified (MQL or SQL) | Opportunities | Pipeline value | Cost per opportunity | Closed won (trailing 90 days) |
|---|---|---|---|---|---|---|---|
| Google Search | |||||||
| Meta | |||||||
| Total |
Getting the CRM column is the hard part. You need the click identifier captured on the form and stored on the contact, or a CRM integration that passes stage changes back to the platform. Google's documentation describes offline conversion import as a legacy feature and recommends new advertisers start with enhanced conversions for leads instead, and its HubSpot connection requires import conditions to be built on the Lifecycle Stage field, with other fields allowed only alongside it in an AND condition. If none of that is wired up yet, leave the CRM columns blank and write "not yet connected" in them.
The CRM column matters because two ads with almost the same cost per lead can cost very different amounts per opportunity once their leads are matched to the CRM. A platform-only report shows those ads as equals, so compare cost per opportunity in the CRM, not cost per lead.
Section 4 logs the changes you made, paired with the number each was meant to move
The changes log lists every material change in the period, the date, the number it was meant to move and what that number did. Most templates skip the log, and that is why nobody can ever say whether the bid change in week 3 did anything.
| Date | Change | Scope | Number it should move | Before | After (or "too early") | Verdict |
|---|---|---|---|---|---|---|
Two rows from the same hypothetical account show both states a row can be in. LinkedIn produced six of the 14 opportunities on $13,800 of spend, which is $2,300 each and the 22% fall the summary reports.
| Date | Change | Scope | Number it should move | Before | After (or "too early") | Verdict |
|---|---|---|---|---|---|---|
| Tuesday, prior week | Paused two awareness campaigns | LinkedIn, 2 of 6 campaigns | LinkedIn cost per opportunity | $2,950 (prior week) | $2,300 (this week, down 22%) | Working, keep paused |
| Thursday, this week | Excluded 40 low-quality placements | Google Display, 1 campaign | Display cost per opportunity | $6,100 (prior four-week average) | Too early | Read again next Monday |
Keep a "too early" state. A change made on Thursday has no verdict on Monday, and pretending otherwise is how teams end up reversing things that were working. We'd expect three or four rows a week on a mature account; if you have fifteen, the report is telling you the account is being touched too often.
Section 5 states the next actions with an owner and a date
Next actions are the three to five things you will do before the next report, each with an owner, a date and the number you expect it to move. Keep "decisions needed from you" as a separate line when there is a budget or targeting call the reader must make.
| Action | Owner | By when | Expected effect | Needs a decision from the reader? |
|---|---|---|---|---|
An appendix can follow with the platform tables: campaign-level spend and conversions, top search terms, top creatives, device and geography splits. Attach it as a second page or a linked sheet, and keep it out of the first.
The freshness stamp protects you from Google's own reporting lag
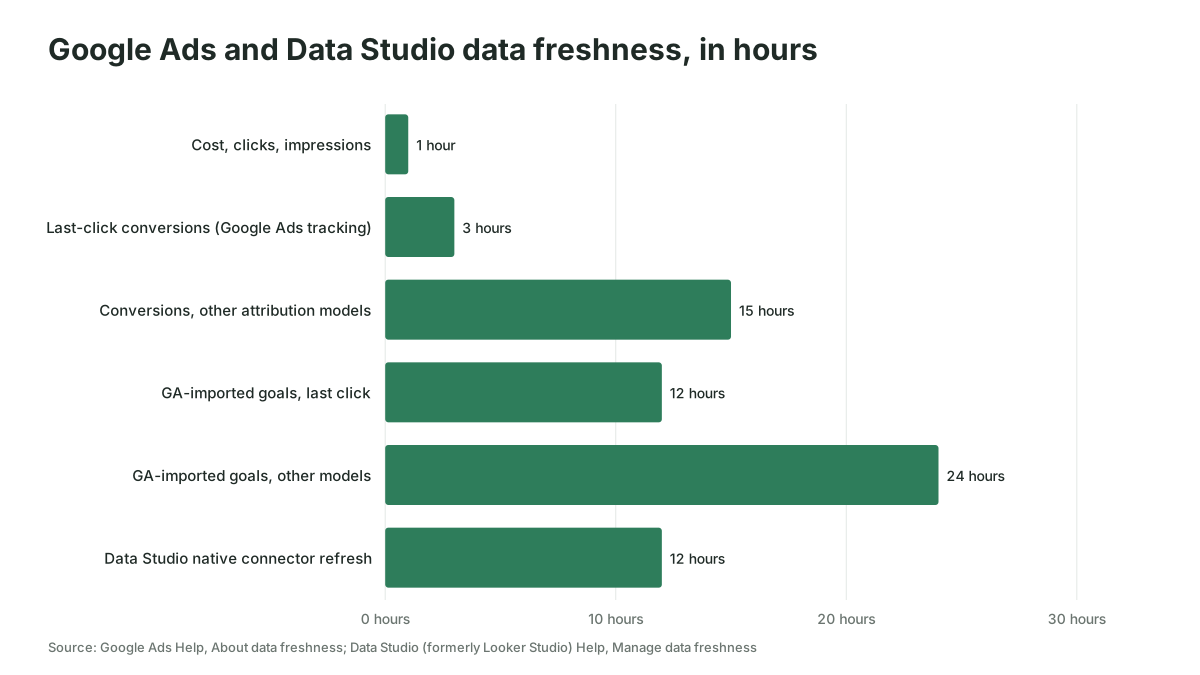
Every weekly PPC report needs a freshness stamp, because the platforms publish spend quickly and conversions slowly, and a Monday morning export mixes the two. Google documents the lag in hours. Clicks, impressions and cost are subject to a one-hour data freshness objective. Last-click conversions from Google Ads conversion tracking are ready in three hours, but conversions under any other attribution model take 15 hours, and goals imported from Google Analytics take 12 hours under last click and 24 hours under other models. Google also notes that reporting metrics may occasionally be updated one or more days after an event occurs.
The consequence for a weekly report is simple. If you pull at 8am Monday, Sunday's spend is complete but Sunday evening's conversions under any non-last-click model have not landed yet, and conversions from the week's clicks keep arriving for weeks, so the week looks more expensive than it was. Google's own conversion-lag page says the same thing in its words: "They can sometimes cause CPA to look inflated and ROAS to look deflated." Pull in the afternoon or on Tuesday, and say in the header which figures are still moving.
The longer lags matter as well. Google reports conversions by query date rather than by the day they happen, and states that conversions can be reported up to 90 days after the click. The "Days to conversion" segment in Google Ads, which splits conversion columns into up to 19 rows, tells you your own account's lag pattern. If 30% of your conversions land more than seven days after the click, write that in the freshness note so the reader expects last week's number to grow.
Dashboards have their own delay on top. Data Studio's (formerly Looker Studio's) native connectors for Google marketing products, including Google Ads, refresh every 12 hours, and Google states that rate cannot be changed. A live dashboard is still a good thing to have, and it is still 12 hours behind.
Weekly reports hold the changes log, monthly reports hold the pipeline story
A weekly PPC report should carry sections 1, 2 and 4 in full and section 3 as far as the data has landed, while the monthly report is where section 3 becomes the main event. Pipeline simply takes longer than a week to form, so a weekly report that leads with opportunities created will swing wildly and teach everyone to ignore it.
Databox's survey of dozens of marketers found that 90.5% keep a consistent PPC reporting format, and that larger budgets are more likely to be tracked weekly. The consistency matters more than the cadence: a template that changes shape every month makes trends impossible to read. We would run the weekly version for anyone spending more than a few thousand dollars a month, and keep the monthly version as the same five sections with a longer comparison window and the closed-won column filled in.
AI fills the template in about an hour if you give it the exports and the rules
The workflow is five exports, one prompt and a human sign-off, and it works with any assistant that accepts a CSV upload. As of November 2026, Claude's help center lists CSV and XLSX among the file types you can upload to a chat, with XLSX needing code execution and file creation enabled in your account. The steps below assume you are working in a chat interface rather than an API; the automation version is in the sibling article linked at the top.
- Export Google Ads. In Google Ads, open Report editor from the Campaigns menu. Build a campaign table with cost, clicks, conversions, conversion value and your target metrics, set the date range to the report period, and save it. Use the email and schedule icon to send it to yourself weekly as a CSV, which Google documents as a scheduling option with frequency and format settings. Reports for an account run from 3am in the account's time zone, so a Monday schedule gives you Sunday's spend in time.
- Export LinkedIn. In Campaign Manager, open the Advertise page, confirm the time range in the upper right, click Export, choose "Ad set performance" or "Ad performance" as the report type, pick a column view, choose a daily or monthly breakdown, and export. Anyone with access to the ad account can download these.
- Export Meta. In Meta Ads Manager, open the Reports drop-down and choose to create a report, which opens Ads Reporting (Meta's help pages label the option Create custom report in one place and Create new report in another). Pick the spend and conversion metrics from the Metrics tab and save the report. As of November 2026, Meta's help center says a saved report can be exported as an .xlsx or .csv file with the Export button, and you need administrator, advertiser or analyst access to the ad account. Meta also lets you schedule a saved report by email from inside the report, for single-account reports only.
- Export the CRM. Pull contacts and opportunities created in the period where the original source is paid, with the channel, campaign, created date, lifecycle stage and amount. Add a trailing 90-day view for closed-won deals and save the whole thing as a CSV.
- Export the plan and last week's report. The media plan row for the period and last week's filled template, so the AI can compute variance and carry forward the "too early" verdicts.
- Run the prompt. Upload the files, paste the prompt below, and read every number it writes against the file it cites.
- Sign it. Rewrite the summary in your own words, add the decision, and put your name in the owner field.
Here is the prompt, with bracketed parts for you to change and rules you should keep.
You are drafting a weekly PPC report from the attached files. Do not invent, round up or estimate any figure that is not in the files. Every number you write must be followed by the file it came from in square brackets, for example [google_ads.csv].

Files:
- google_ads.csv: campaign-level cost, clicks, conversions, conversion value for [period]
- linkedin.csv: ad set performance for [period]
- meta.csv: Ads Reporting export of spend and conversions for [period]
- crm.csv: contacts and opportunities created in [period] with original source = paid, plus closed-won deals from the trailing 90 days
- plan.csv: planned spend per channel for [period]
- last_week.md: last week's completed report

Produce these sections in this order, as Markdown tables matching the headers in last_week.md:
1. Summary: four lines (outcome, cost of outcome, what moved, decision). Leave the decision line as "[owner to complete]".
2. Spend vs plan: per channel and total, with variance in dollars and percent. For the reason column, propose a reason only when the data supports it; otherwise write "reason needed".
3. Pipeline outcomes: CRM leads, qualified, opportunities, pipeline value and cost per opportunity per channel, with platform conversions alongside. Where the CRM has no record for a channel, write "not connected" rather than using platform conversions.
4. Changes made: carry forward every row from last_week.md marked "too early" and update its After and Verdict columns from this week's data. Add new rows only from the change notes I paste below.
5. Next actions: draft three to five, each with the number it should move. Mark anything that needs a budget or targeting decision.

Then add a "Checks" list: any figure that moved more than 25% week on week, any channel where platform conversions and CRM leads differ by more than 30%, and any metric that is still provisional given the data was pulled at [date and time]. Google Ads non-last-click conversions can take 15 hours to appear and can keep arriving for up to 90 days after the click.

Change notes for this week:
[paste the changes you made, with dates]
The two rules that make this safe are the source tag on every number and the "not connected" instruction. Models fill gaps confidently, and the only reliable way to stop them is to make the gap itself the answer.
If you have connected an AI client directly to the account, the export steps collapse. Google documents its own Google Ads MCP server on developers.google.com. Its documentation now lists its mode as "Read and partial mutate" with a "configurable read-only mode", and the November 2, 2026 release added asset and label write tools behind a confirmation step. It cannot change bids, budgets or campaign status, and its search tool runs Google Ads Query Language queries, so an assistant can pull the campaign table itself. The set-up, the alternatives and the trade-offs are covered in Google Ads MCP: how to connect Claude or ChatGPT to your Google Ads account.
The report fails in four predictable ways
The template breaks when platform conversions get relabeled as leads, when the changes log is skipped, when the pull happens before the data has landed, and when the AI draft goes out unread. Each one is easy to spot once you know to look.
Relabeling is the most common. The CRM export is late or messy, so someone types the Google Ads conversion count into the "CRM leads" column to get the report out. From then on the report is measuring form fills and calling them pipeline, and the first person to notice will be the sales leader who asks why 60 "leads" produced two meetings. Leave the cell blank instead.
Skipping the log feels harmless because the changes are "in the platform history anyway." They are, and nobody will ever go and look. Without the log, the report can describe what happened but never why, and the recommendations section turns into the same three bullet points every week.
Pulling early makes the account look worse every Monday and better by Wednesday, which trains the reader to distrust the number. Stamp the pull time and move it later.
And sending the draft unread is the AI-specific failure. A model that has been asked to find a reason for a variance will find one, whether or not the data supports it. The prompt's "reason needed" instruction helps, but the owner reading every number against its source is the control.
You know the template works when the budget question stops arriving by email
The template is working when spend and pipeline sit on the same page, the reader stops asking what the money bought, and the changes log shows verdicts rather than a stream of "too early." Three or four weeks in, you should also be able to read the log and see the account's recent history in a minute. For how to put a value on the hours this saves and the mistakes it avoids, see How to measure the ROI of AI in your paid team.
Where to start this week
Copy the five tables into a document, fill the header block and section 2 from this week's exports, and leave every CRM cell you cannot fill blank. The blanks will tell you which connection to fix first. If you'd like help setting up the exports, the prompt and the CRM link so the report drafts itself each week, that is the kind of work Scalewell does with paid teams.
Frequently asked questions
What should a weekly PPC report include?
A weekly PPC report should include the period and comparison dates, spend against plan per channel with a reason for any variance, the conversions and CRM leads produced so far, a log of the week's changes paired with the number each was meant to move, and three to five next actions with owners. Platform detail goes in an appendix.
How is a PPC report different from a PPC dashboard?
A dashboard shows live metrics and leaves the reader to interpret them, while a report states what happened, why, what you did and what comes next, for one fixed period, signed by a person. Most teams need both of them.
Can I use this template for a Google Ads report on its own?
Yes, the template works for a single Google Ads account. Drop the other channel rows, keep the five sections and the freshness stamp, and add a Google-specific appendix with search terms, auction insights and top assets. Google updates auction insights and impression share about once a day, so those appendix figures lag the cost figures.
How do I report pipeline when the CRM is not connected to the ad platforms?
Report platform conversions in their own column and write "not connected" in the CRM columns rather than copying numbers across. Then make the connection a next action: capture the click identifier on your forms, store it on the contact, and set up enhanced conversions for leads or a CRM integration so stage changes flow back to the platform.