Marketing efficiency for a B2B paid team: measuring output and productivity once AI does part of the work
Once AI does part of a paid team's work, campaign dashboards stop describing the team, so measure pipeline per head, fully loaded cost per opportunity, tests concluded, time to decision and the judgment share of hours.

The most useful measure of marketing efficiency in a B2B paid team is the pipeline it creates per dollar it costs, counting salaries, tools and agency fees next to media. Once AI does part of the work, track five numbers: pipeline per head, fully loaded cost per opportunity, tests concluded, time to decision and the share of hours on judgment.
You usually meet this question in the budget review, a few months after the AI seats were approved. The CFO asks whether the team is more productive now, and the honest answer is a campaign dashboard full of click-through rates and a sense that everyone seems busier. The dashboard describes the media. Nobody in the room has a number for the people who run it.
This guide is for the CMO, VP Marketing or head of demand gen who has to answer that question. It proposes definitions of both terms that finance can check, shows what the research says about AI productivity gains, and gives you a filled-in, hypothetical team scorecard to copy.
Campaign dashboards measure the media and leave out a quarter of the budget
The people who run paid media are a large and growing share of the marketing budget, and almost no standard report measures them. In Gartner's 2026 CMO Spend Survey of 401 CMOs, fielded from January to March 2026, labor rose from a mean 21.9% of the marketing budget in 2025 to 24.5% in 2026, as Chief Marketer reported on June 24, 2026. The same report says 43% of CMOs expected to reduce labor spending this year.
So a quarter of the money is under pressure, on the assumption that AI lets fewer people do more. The CMO Survey's 2026 edition, published in March 2026 from 308 US marketing leaders, found marketing headcount growth "declining more than 50% from last year's rate". With headcount growth slowing and expectations rising, someone will ask what each person on the team produces, and you want to have answered first with numbers you chose.
Scalewell helps marketing leaders audit their paid team's week so that the jobs AI takes on are the ones that move these numbers, and the hours that come back go to planning and testing instead of more production.
Measure B2B marketing efficiency as pipeline per fully loaded dollar
There is no standard definition of marketing efficiency for a B2B paid team, so this guide recommends one: qualified pipeline from paid channels divided by the total cost of producing it, meaning media, people, tools and outside help. That measure puts the team inside the sum, which is the point once AI is shifting money between salaries and software.
You will see "marketing efficiency ratio" in search results, and it is the wrong tool here. MER is defined as revenue divided by paid marketing spend, and it is "a metric used to measure the efficiency of an ecommerce company's marketing efforts". It leaves out the people and assumes revenue arrives inside the reporting period, which suits a store that sells on the day of the click and fails in B2B. Dreamdata's March 10, 2026 benchmark release says the full B2B buyer journey "has extended from 211 days to 272 days," so revenue booked this quarter can reflect work done about three quarters earlier.
Two efficiency numbers fit a long cycle better:
- Pipeline per paid head: qualified pipeline from paid channels in the quarter, divided by the people on the paid team (full-time equivalents, including contractors). It answers the CEO's question but ignores media spend, so read it beside the next one.
- Fully loaded cost per qualified opportunity: media plus people plus tools plus agency, divided by the qualified opportunities paid channels created. Adding the non-media lines shows whether AI spend is replacing labor or stacking on top of it.
Both come from the CRM, so settle the opportunity definition with sales before you build a scorecard on it.
Marketing productivity is output per hour, and AI makes the wrong outputs cheap
Marketing productivity is the useful output a team produces per hour worked, and the hard part is deciding which outputs are useful. Volume used to be a rough proxy, because shipping more ads and reports took more work. Once a model drafts the ads and assembles the report, volume costs almost nothing and stops telling you anything.
The research shows where the hours go instead. In Noy and Zhang's experiment, published in Science in July 2023, 453 college-educated professionals, marketers among them, did writing tasks with or without ChatGPT: "The average time taken decreased by 40% and output quality rose by 18%." The authors' March 2023 working paper adds the finding that matters for measurement: the tool "restructures tasks towards idea-generation and editing and away from rough-drafting." A study of 5,179 customer support agents by Brynjolfsson, Li and Raymond found a 14% average rise in issues resolved per hour, and 34% for novice and low-skilled workers.
So AI gives people back drafting time and moves them toward choosing and editing. For a paid team the matching outputs are decisions: a test that reached a conclusion, a budget moved on evidence, an anomaly explained before it cost a week of spend.
AI productivity gains in surveys are smaller than in experiments, so measure your own baseline
The productivity gains workers report in everyday use are a fraction of what controlled experiments find. Humlum and Vestergaard's NBER working paper (revised March 2026), which links surveys of Danish workers in 11 AI-exposed occupations, marketing professionals included, to administrative records, finds that "adopters in our sample report savings of about 3% of their work hours." In the US, Bick, Blandin and Deming's November 2024 national survey, summarized by the St. Louis Fed, found an average time saving of 5.4% of work hours among generative AI users and 1.4% across all workers.
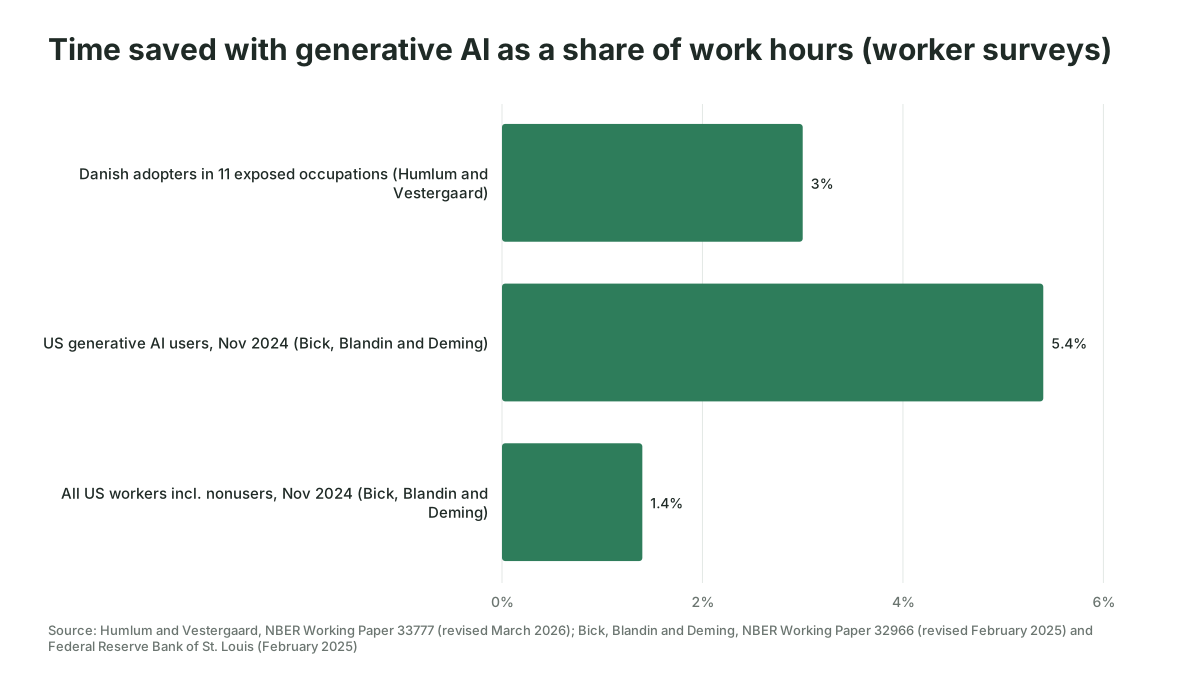
That gap tells a marketing leader two things. A faster task does not make a faster week, because the task is a small part of the week, so a team claiming ten hours saved is worth a second look. And in the same Danish paper, 85% of chatbot users report moving the time they saved to other job tasks, so most of it goes into other work rather than showing up as spare hours.
Take your baseline before the AI work starts, using the time-log method in our guide to measuring AI marketing ROI, or you will have nothing to compare against.
The marketing team productivity scorecard has five measures and one guardrail
A paid team scorecard works when each number is hard to inflate on its own and is read beside a number that would expose the inflation. Software teams already work this way: the DORA research program pairs throughput measures, such as how often a team deploys, with instability measures, such as the share of deployments that need fixing afterward.
| Group | Measure | Definition | Source | Why it resists gaming |
|---|---|---|---|---|
| Efficiency | Pipeline per paid head | Qualified pipeline from paid channels per quarter, divided by full-time equivalents on the paid team | CRM and headcount | Pipeline is owned by sales stages, not by the team |
| Efficiency | Fully loaded cost per qualified opportunity | Media, people, tools and agency fees, divided by qualified opportunities from paid | CRM and finance | Adding AI tools without cutting other cost shows up here |
| Output | Tests concluded per month | Tests that reached their planned end date and produced a written decision to keep, change or stop | Google Ads Experiments page, LinkedIn Campaign Manager Test tab, team log | A test with no written decision does not count |
| Output | Time to decision | Median working days from a performance question or anomaly being raised to a decision being logged | Team log or ticket system | Fast drafts do not help unless someone decides |
| Mix | Share of hours on judgment | Hours on planning, test design, budget calls and creative choice, divided by all logged hours | Two-week time log, twice a year | Shows where returned hours went |
| Guardrail | Errors reaching the account | Changes rolled back, overspends and broken tracking found after going live, per month | Change history and incident log | Speed bought with mistakes shows up here |
A test counts when it ran to its planned end and someone wrote down what changed as a result; on LinkedIn that is never less than two weeks, because LinkedIn's help page says an A/B test "needs to run for a minimum of 2 weeks and a maximum of 90 days". Small B2B audiences limit how many tests can run at once, so compare the count with your own history.
The judgment share needs a written list. Planning, test design, budget allocation, creative choice and talking to sales count as judgment; building campaigns, assembling reports, QA and uploads count as production, even when skilled. Our guide to mapping AI marketing workflows shows how to list the tasks the team repeats.
A filled-in scorecard for a hypothetical six-person paid team
The scorecard below is hypothetical, with invented figures. Imagine a B2B software company whose paid team has six people: a head of paid media, three specialists, an analyst and a marketing operations manager. Their loaded cost is $195,000 a quarter, media spend is $600,000 a quarter across Google Ads, LinkedIn Ads and Meta, tools and agency fees come to $45,000, and the average qualified opportunity is worth $30,000. Between Q1 and Q3 the team moved its weekly report, pacing checks and search term review onto an AI set-up costing $15,000 a quarter. The targets in the last column are the team's own, agreed with its CMO.
| Measure | Q1 (before) | Q3 (after) | Q4 target (team-set) |
|---|---|---|---|
| Total quarterly cost | $840,000 | $855,000 | $855,000 |
| Qualified opportunities from paid | 120 | 132 | 140 |
| Pipeline per paid head (quarter) | $600,000 | $660,000 | $700,000 |
| Fully loaded cost per qualified opportunity | $7,000 | $6,477 | Under $6,200 |
| Media-only cost per qualified opportunity | $5,000 | $4,545 | Under $4,300 |
| Tests concluded per month | 2 | 5 | 6 |
| Median time to decision | 9 working days | 3 working days | 3 working days or fewer |
| Share of hours on judgment | 30% | 50% | 55% |
| Errors reaching the account per month | 3 | 1 | 1 or fewer |
The output and mix rows moved a lot, and the efficiency rows moved a little. Pipeline per head rose 10% and fully loaded cost per opportunity fell by about 7%, while the total cost went up by $15,000 because the AI set-up was added without removing anything.
How should the CMO read that? The output gains are attributable, because the team logged them before and after. The efficiency gain is plausible but unproven, since a 10% rise in opportunities could be the market, a new product page or the platforms' own bidding. To claim it for the team's new way of working, run a holdout or wait a full sales cycle. Until then, report it as "pending" and lead with the rows you can defend.
One row is missing on purpose. Ads launched per month went from 40 to 160 because the model drafts variants, and on the scorecard that would be the biggest improvement on the page and the least meaningful.
Five numbers that look like productivity and should stay off the scorecard
Some measures rise every time a team adopts AI, whether or not anything improved. Keep these in the team's own operating report, if anywhere:
- Ads, assets or reports produced. AI makes them cheap, so the count rises with no change in pipeline. Count the tests they fed instead.
- Hours saved, as estimated by the team. A number from memory cannot be checked, and the surveys above show how far reported savings sit from experimental ones. Use logged hours, and report where they went.
- AI seats used or prompts sent. Usage says the tool is open, not that the work changed.
- Cost per lead and click-through rate. Both are campaign measures, and both can improve while pipeline falls.
- Individual output leaderboards. Ranking specialists by tests or launches invites small, safe tests and splits work that should be shared.
Team scorecards fail when they arrive too early or measure the wrong unit
The most common failure is reading the efficiency rows inside one quarter. With a journey Dreamdata measures in months, a change in how the team works shows up in opportunities after a quarter or two and in revenue much later, so judge them on a two-quarter trend.
The second failure is starting without a baseline. If the AI set-up is already live, log two weeks of hours, pull last year's test count from change history, and say in the report that the "before" is reconstructed.
Finally, the scorecard can become the job: when a measure becomes a target, people find the cheapest way to hit it. If tests concluded jumps while the share of tests that changed a budget or a creative falls, the count is being gamed. Our AI training guide for marketing teams covers the related habit of checking what the model produces before it goes live.
How Scalewell finds the jobs that move a paid team's scorecard
Scalewell starts with the team's week, so the hours AI returns turn into more concluded tests and faster decisions. A free 30-minute call comes first. The audit that follows lists every recurring job on the paid team, ranks the one AI should take over first, and turns that order into a roadmap.
In a build sprint of typically 8 to 12 weeks, sometimes longer, those jobs are built inside the team's current software, plus new systems where needed. B2B paid media practitioners do that work and rate every job on hours returned and pipeline. AI then does real work each week, the next jobs are queued, and the team can run and change it alone.
Report the team scorecard beside the campaign numbers every quarter
The team scorecard belongs in the quarterly pack beside the campaign results, on one page, with four quarters of trend and a sentence per row on what changed. Put efficiency first, because that is the CFO's question, then output and mix, which explain it, then the guardrail.
Mark each efficiency change as proven or pending. Our guide to reporting marketing ROI to the board covers how to fit that into a board pack. And if the scorecard shows the team has hours but no clear place to put them, an AI opportunity assessment of the week is the next step.
Where to start
Pull last quarter's figures for the five measures this week, even roughly, and start a two-week time log so next quarter has a real baseline. If you want a partner for that, Scalewell works alongside paid and demand gen leaders to pick the first AI jobs that will move those numbers.
Frequently asked questions
What is a good marketing efficiency ratio for B2B?
There is no credible public benchmark for B2B, and the marketing efficiency ratio itself comes from ecommerce, where revenue tends to arrive soon after the click. For a B2B paid team, track qualified pipeline per fully loaded dollar and fully loaded cost per opportunity against your own previous quarters, and judge the trend over at least two quarters.
How do you measure marketing team productivity without micromanaging people?
Measure the team as a unit and use numbers the systems already hold: tests concluded from the ad platforms' change history, decisions from a shared log, pipeline from the CRM. Run a time log only twice a year, for two weeks, and use it to see the mix of work, never to rank individuals against each other.
Does AI reduce the size of a marketing team?
The evidence so far says not much. In the March 2026 version of their Danish study, Humlum and Vestergaard estimate "precise null effects on earnings and recorded hours," ruling out effects larger than 2% two years after ChatGPT launched. Budgets tell a different story: 43% of CMOs in Gartner's 2026 survey expected to cut labor spending, so the pressure is real even where the data is thin.
How many people should run paid media for a given budget?
No credible published ratio exists, because team size depends on the number of channels, markets, creative volume and how much reporting is automated. Track pipeline per paid head and fully loaded cost per opportunity for your own team instead, and use them to decide whether the next hire or the next AI job returns more.
Which AI productivity gains can a marketing leader claim to a CFO?
Claim the gains you logged before and after: hours moved from production to judgment, more tests concluded, faster decisions and fewer errors reaching the account. Report any rise in pipeline as pending until a holdout or a full sales cycle supports it, because platform automation and market changes move pipeline at the same time.