AI opportunity assessment: audit your marketing team's week to find where AI pays back first
A leader's AI opportunity assessment that prices every recurring job in hours and pipeline, with the scoring arithmetic and a filled-in hypothetical table.

An AI opportunity assessment lists the recurring jobs in your marketing team's week, prices each in hours and in the spend or pipeline it steers, scores it for payback and risk, and picks the first one or two jobs AI should take on. For a B2B demand gen team it takes about three weeks and ends in one ranked table.
The question usually lands in the planning cycle. The CEO wants to know where AI shows up in marketing's plan, finance wants to know what it will cost, and you have a team that already uses three chatbots and a slide of vendor logos. Nobody has a number per job, so the first AI budget follows whichever demo impressed most.
This guide is for the CMO, VP Marketing or head of demand gen who has to make that call and defend it. It gives you the five numbers to collect per job, the scoring arithmetic, a filled-in hypothetical assessment, the jobs where AI does not pay back, and a rule for picking the first two.
An AI opportunity assessment decides where the money goes first
An AI opportunity assessment answers one question a readiness check does not: which job, out of everything your team repeats, should get the first AI money. Our AI readiness assessment for paid media teams scores whether the team has the data, skills and rules to start. This one assumes you can start and asks where the return is, in dollars, which is where an AI use case assessment grid scored 1 to 5 stops short.
In Gartner's 2026 CMO Spend Survey, 15.3% of marketing budgets on average went to AI, as Marketing Dive reported on May 11, 2026, and in many teams that money is committed before anyone has priced the jobs it is meant to change.
The companies that get value from AI also do fewer things with it. In BCG's October 2024 survey of 1,000 CxOs and senior executives across 59 countries, 74% of companies had yet to show tangible value from AI, and the leaders "pursue, on average, only about half as many opportunities as their less advanced peers" (BCG). For a marketing team, that argues for a short list. Scalewell helps marketing leaders run this audit of the team's week, so the first AI budget goes to the job with a payback finance can check rather than to the best demo of the quarter.
Inventory every recurring job with five numbers
An AI opportunity assessment starts with an inventory: one row per recurring job, with hours a year, frequency, the data the job needs, the cost of an error and the person who signs off. Take them from a two-week time log, because memory inflates the hours on disliked jobs and forgets the small daily ones.
Cover the whole demand gen week, including the jobs that sit outside the ad accounts. The jobs with the most money behind them often sit at the seams: the lead quality review between marketing and sales, the upload that sends CRM stages back to Google Ads, LinkedIn and Microsoft Advertising, the report the leadership team reads on Monday. Your paid team will find the detailed logging method in how to map a paid team's week before automating; the leader's version needs only these columns:
| Field | What to record | Why the CFO cares |
|---|---|---|
| Hours a year | Logged minutes per run, times runs per year | The capacity the job could free |
| Frequency | Daily, weekly, monthly or quarterly | Rare jobs rarely repay a build |
| Data needed | Each system the job reads, and whether AI can reach it today | A missing connection is a cost line |
| Error cost | What a wrong run costs, in plain words and dollars | Sets the risk score and the review time |
| Who signs off | The named person who approves the output | Review hours are a running cost |
Plan for 15 to 25 rows in a team of four to six people. Leave out anything the ad platforms already do for you, such as bidding: Google, LinkedIn and Meta run their own automated bidding, so those hours are not yours to save.
Price each job in hours first and pipeline second
Each job gets two values: a counted capacity value in dollars, which decides payback, and the spend or pipeline its output steers, which decides priority. You need both because they rank jobs differently.
Capacity value is the hours AI can take from the job, times a loaded hourly rate. Salary alone undercounts what a person costs. In the Bureau of Labor Statistics' Employer Costs for Employee Compensation release of September 9, 2026, covering June 2026, wages and salaries were 70.0% of private-industry employer compensation costs and benefits the remaining 30.0%. So divide a salary by 0.70: a hypothetical $105,000 marketer costs $150,000 a year, or $75 an hour over an assumed 2,000 working hours.
Two discounts keep that number honest. Estimate the share of each job AI can realistically take, which is rarely all of it, and count the hours only if they go to named work or come off an agency invoice. Hours that simply disappear into the week are real for the team and worth zero to finance, a rule our guide to measuring AI marketing ROI sets out in full.
Pipeline exposure is the spend or pipeline that moves when the job's output changes. A daily pacing check protects the whole budget from a weekend overspend. The weekly lead quality review decides which sources keep their money. A slide template steers nothing. Write the figure down even though you can't bank it yet, because in B2B the effect arrives late: Dreamdata's 2026 benchmarks release, drawn from 3.5 million customer journeys, found that the full B2B buyer journey now runs 272 days. A job that improves which leads become opportunities will show it in closed revenue three quarters later, so its value sits in a pending column until then.
Score payback and risk with simple arithmetic
The scoring uses five lines of arithmetic and one risk scale, all of which fit on a spreadsheet tab your finance partner can audit.
Capacity value a year  = hours a year x share AI takes x loaded hourly rate
Running cost a year    = review hours a year x loaded rate + tools and usage
Net value a year       = capacity value - running cost
Payback in months      = one-off build cost / (net value a year / 12)
Opportunities to break even (year one) = (build cost - net value a year)
                         / (average contract value x win rate x gross margin)
The last line is the one a CFO will look for: it converts a job that does not pay back on hours into the extra opportunities it must create in year one to cover its cost. The review hours deserve care too, because AI output that looks finished and isn't costs real time downstream. In a September 2025 survey of 1,150 full-time US desk workers by BetterUp and the Stanford Social Media Lab, 40% said they had received such "workslop" in the past month, and BetterUp estimates the wasted effort at $186 per employee per month (BetterUp). Budget the checking time before you count the saving.
Risk gets a score from 1 to 3. Give a 1 when a person reads the output before anything happens, such as a report or an alert, and a 2 when the job changes something live but visible and reversible the same day, or feeds a signal to an ad platform. Reserve 3 for jobs that move spend or make a decision whose error could go unnoticed for days. Data readiness works as a gate on top: if AI can't reach the job's inputs today, the connection becomes part of the build cost.
The decision rule then picks two jobs, each for a different reason. Job one is the shortest payback among jobs with risk 1 and data ready, because it pays for itself and builds the team's trust in AI output. Job two is the largest pipeline exposure among jobs with risk 2 or lower that don't depend on another job's output, run as recommend-only, because that is where the money is. Anything with payback beyond 24 months on hours and no pipeline exposure is left alone.
A filled-in AI opportunity assessment for a hypothetical B2B team
Imagine a hypothetical B2B SaaS company with a five-person demand gen team, $2.4 million a year in paid media across Google Ads, LinkedIn, Meta and Microsoft Advertising, a $45,000 average contract value, a 25% win rate and 80% gross margin. Every figure below is invented to show the arithmetic, at a loaded rate of $75 an hour. The inventory comes first, with the five numbers per job.
| Job | Hours a year | Frequency | Data needed | Error cost | Signs off |
|---|---|---|---|---|---|
| A. Monday pipeline and spend report for leadership | 168 | Weekly | Four ad platforms, CRM | A wrong number in front of the CEO, corrected the same day | Head of demand gen |
| B. Daily pacing and tracking checks | 115 | Daily | Four ad platforms | A missed alert, so an overspend or dead tag runs a day longer | Paid specialist |
| C. Search term review and negatives | 120 | Weekly | Google Ads, Microsoft Advertising | A good query blocked, reversible the same day | Paid specialist |
| D. Lead quality review by source, including LinkedIn Lead Gen Forms | 144 | Weekly | Ad platforms, CRM stages (not yet connected) | Budget kept on a source that sales never converts | Head of demand gen with sales |
| E. Upload of CRM stages as offline conversions | 72 | Weekly | CRM, three ad platforms | Bidding learns from the wrong stage for weeks | Marketing ops |
| F. Ad copy variants for tests | 72 | Monthly | Briefs, past results | A weak variant rejected before launch | Creative lead |
| G. Monthly budget reallocation | 96 | Monthly | All of the above | Thousands of dollars moved to the wrong place | Head of demand gen |
| H. Quarterly media plan | 96 | Quarterly | Plan, results, finance targets | A channel budget set wrong for a quarter | CMO |
Next comes the scoring table, row by row. Build cost is internal hours at $75 plus any outside work, and the running cost is review time plus tools.
| Job | Share AI takes | Capacity value a year | Build cost | Running cost a year | Payback on hours | Risk | Spend or pipeline it steers | Verdict |
|---|---|---|---|---|---|---|---|---|
| A | 70% | $8,820 | $3,000 | $2,400 | 5.6 months | 1 | Informs every budget decision | Third |
| B | 80% | $6,900 | $2,250 | $1,200 | 4.7 months | 1 | Protects $2.4M of spend | Job one |
| C | 60% | $5,400 | $2,250 | $3,000 | 11.2 months | 2 | About $1M of search spend | Later |
| D | 50% | $5,400 | $12,500 | $4,200 | 125 months | 2 | About $1.2M of lead gen spend | Job two |
| E | 90% | $4,860 | $9,000 | $1,200 | 29.5 months | 2 | What bidding optimizes on $2.4M | After D |
| F | 50% | $2,700 | $1,500 | $2,100 | 30 months | 1 | Little directly | Individual AI use only |
| G | 30% | $2,160 | $3,000 | $2,100 | 50 years | 3 | $2.4M | Leave with a person |
| H | 25% | $1,800 | $3,000 | $1,500 | 10 years | 3 | $2.4M | Leave |
Here is the arithmetic for job B. AI takes 80% of 115 hours, or 92 hours, worth $6,900 at $75. Review is 12 hours a year ($900) plus $300 of tools, so net value is $5,700 a year, or $475 a month. A build of 30 internal hours costs $2,250, which pays back in 4.7 months.
Job D looks hopeless on hours, with a payback of over ten years. Run the break-even line instead: the first-year gap is $12,500 of build minus $1,200 of net value, or $11,300, and each opportunity is worth $45,000 x 25% x 80% = $9,000 in expected gross profit. So the lead quality review needs to create about 1.3 extra opportunities in its first year to cover itself, from a job that decides where $1.2 million of lead gen spend goes. Few leaders would turn down that bet, and almost none would spot it ranking by hours.
That gives the team its two jobs. B pays for itself inside six months. D runs as recommend-only, with AI scoring each source's leads against CRM stages and the head of demand gen moving the money. E steers more money but depends on D: it can only start once D has produced a qualified-lead definition sales agrees with, because that definition is what E sends to the ad platforms. The tasks inside each job, and their order, are what which paid media tasks to automate first covers for the practitioner.
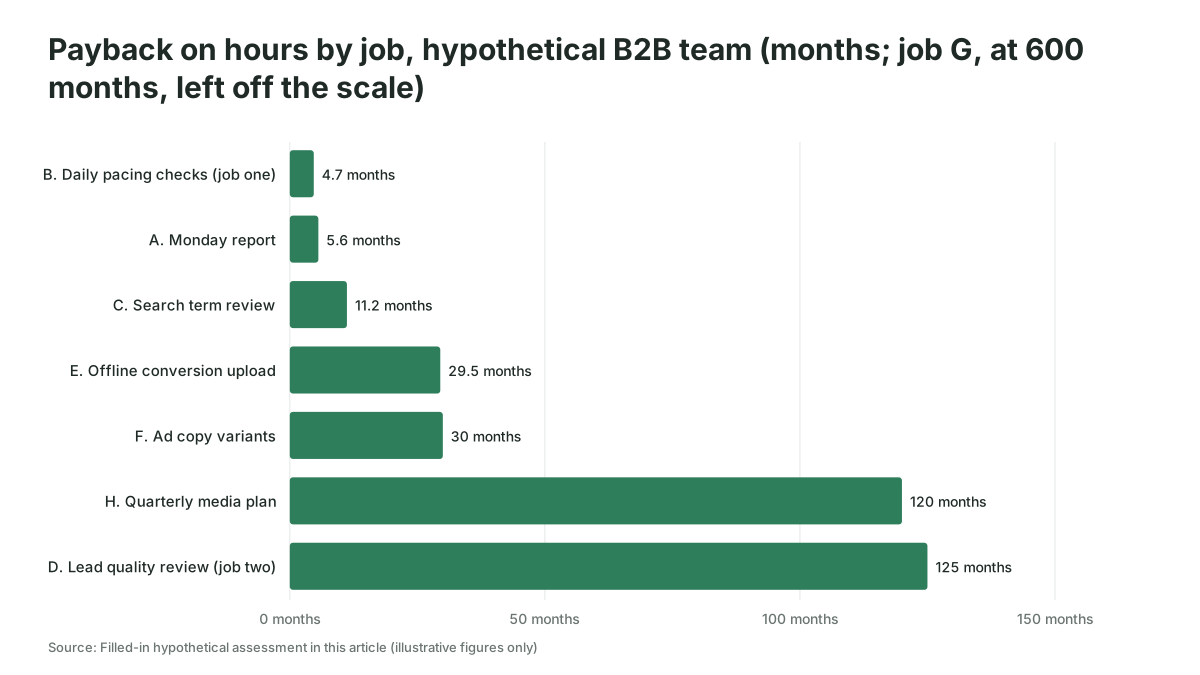
AI does not pay back on rare, judgment-heavy or data-starved jobs
AI pays back worst on jobs that happen a few times a year, jobs whose rule lives in one senior person's head, and jobs whose data AI can't reach. Rows G and H show the first two: the quarterly plan and the budget reallocation have large dollars behind them, but they run too rarely to repay a build and their errors are expensive and slow to surface. Let AI prepare the options for both, and leave the call with whoever owns the budget.
The third kind fails quietly: inputs that arrive as screenshots, or a CRM field half the team leaves blank, turn every AI run into a cleanup job. Gartner predicted that at least 30% of generative AI projects would be abandoned after proof of concept by the end of 2025, "due to poor data quality, inadequate risk controls, escalating costs or unclear business value," as Intelligent CIO reported on August 5, 2024. An opportunity assessment catches the first and last of those reasons before the money is spent: a data gap shows up as a build cost, and unclear value shows up as a row nobody can price.
Two more traps are common. Ranking by hours alone puts the reallocation decision near the top, because it is a big block of senior time, and that is the job where a confident wrong answer costs most. And a team of one or two people should skip the full exercise, pick the single job with the shortest payback, and start there.
There is also a limit to what the break-even line can prove. In the hypothetical, job D needs 1.3 extra opportunities a year, and no team can measure a change that small against the normal noise in its pipeline. Judge it instead on the decision it changes: did money move off the source with the worst opportunity rate, and did the cost per opportunity of that money improve over a full sales cycle?
How Scalewell turns the assessment into the first two AI jobs
Scalewell's part starts with the question this article answers: where the first AI money goes, with arithmetic finance can follow. A free 30-minute call opens it. The audit of your team's week then logs the recurring jobs, prices each against time saved and pipeline, and ranks them into a roadmap.
During a build sprint, usually 8 to 12 weeks and sometimes longer, the first jobs get built inside the tools your people already use, with new systems only where a job needs one. B2B paid media practitioners do the work. You finish with AI doing real jobs in the week, the next ones ranked, and a team trained to run and adjust them on its own.
Take two jobs, a cost and a review date to the CFO
The output of an AI opportunity assessment is a one-page decision: the two jobs, what each costs in year one, when the first pays back, how many opportunities the second needs to break even, and the date you will report on both.
Report the first job at 90 days on hours, checked against a second time log, and the second after one full sales cycle, on the two questions set out above for job D: whether money moved, and what it cost per opportunity. If you need the full costs and returns written up for a budget request, our guide to the business case for AI in B2B paid media builds on this table, and the ranked AI roadmap for a B2B marketing team orders the remaining rows over 12 months.
Where to start
Ask everyone on the demand gen team to log their recurring jobs for the next two weeks, with minutes per run, and book a session with your finance partner to agree the loaded hourly rate before the scoring starts. Scalewell can take it from there with you, turning the two jobs at the top of the table into work AI does every week.
Frequently asked questions
What is AI opportunity mapping?
AI opportunity mapping is the first half of an opportunity assessment: listing the recurring jobs in a team or process and marking where AI could take part of the work. The assessment adds the numbers, pricing each job's value, cost and risk, so the map turns into a ranked decision rather than a wall of sticky notes from a workshop.
How long does an AI opportunity assessment take for a marketing team?
For a demand gen team of four to six people, plan on about three weeks: two weeks of time logging, then two or three working sessions to fill in error costs, data access and sign-off and to score the rows. The time log is the slow part, and it is the part that makes the hours credible to finance.
How many AI use cases should a marketing team start with?
Start with one or two. One job that pays back quickly and one that steers pipeline is enough to prove the method, train the team and give finance a first result within a quarter.
Should an outside firm run the AI opportunity assessment?
An outside firm can speed up the logging and bring a scoring method, but the head of demand gen should own the result, because the team has to accept the hours and error costs as true before it will change how it works. Whoever runs it, insist on logged hours rather than interview estimates.