Demand generation strategy: where AI fits in the annual and quarterly planning cycle
A demand generation strategy plans across a buying cycle that is longer than the quarter you report in, and this guide places AI at each stage of that cycle, from the annual reverse math to the weekly pacing check, with rules for which decisions stay with you.

A demand generation strategy is the plan for how a B2B company creates demand among buyers who are not looking yet, captures it when they are, and turns both into qualified pipeline over a full buying cycle. AI has a different job at each of the plan's three cadences: the annual bet, the quarterly re-allocation and the weekly check.
It's the budget review in the second week of a new quarter, and the CFO wants to know what last quarter's spend produced. The honest answer is that most of it hasn't produced anything yet, because the people it reached won't buy for months. The slide you have shows leads.
This guide walks the planning cycle from the annual revenue target down to the weekly pacing check and places AI at each stage, with a clear line on which decisions it informs and which stay with you. It's written for the CMO or head of demand gen who owns the number. For the paid media plan underneath it, see building a paid media strategy for an AI-assisted team.
A demand generation strategy plans across a buying cycle, while a lead plan covers a quarter
A demand generation strategy sets out how you will create interest in a problem and a category, and how you will capture it when a buyer starts searching. Salesforce describes demand generation as "a top-of-funnel marketing strategy that drums up interest in a product or service" and lead generation as the work "to identify prospects, pull them in your ecosystem, and start a sales conversation" (Salesforce). Lead generation is one part of the strategy, and the common mistake is running it as the whole thing.
The reason comes from how B2B buying works. Research by Professor John Dawes of the Ehrenberg-Bass Institute for the LinkedIn B2B Institute found in 2021 that up to 95% of businesses are not in the market for most goods and services at any one time, which works out to about 20% in a given year and about 5% in a given quarter (Ehrenberg-Bass Institute). So the budget you spend this quarter reaches a group where roughly one buyer in twenty could buy before the quarter ends, and the other nineteen are the quarters that follow.
Dreamdata's write-up of a Dawes talk puts the stakes plainly: "If there are potential buyers out there who basically know nothing about us they have almost zero chance of buying from us" (Dreamdata). A demand generation strategy is the document that decides how much you invest in those nineteen, and how you'll know it was worth it.
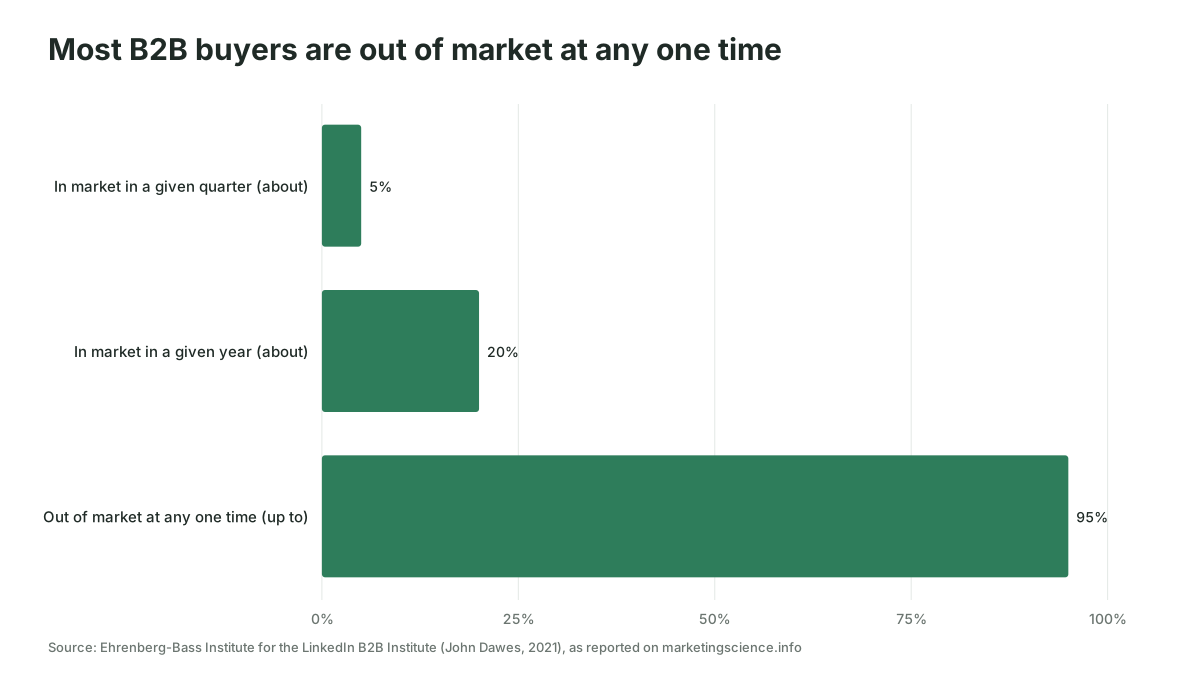
The buying journey is longer than the quarter you plan in
The average B2B buying cycle ran about 10 months in 2025, so a quarterly review judges work that started two or three quarters earlier. That figure comes from 6sense's 2025 Buyer Experience Report, drawn from just under 4,000 respondents, which measured cycles shortening from about 11 months in 2024 to 10 months in 2025 (6sense). The same study found that 94% of buying groups had ranked their preferred vendors before first contact with any seller, and the vendor ranked first went on to win roughly four deals in five (6sense).
Dreamdata's 2022 benchmark from 414 B2B companies put the journey from first anonymous touch to closed-won at 233 days for B2B SaaS (Dreamdata), so the deal you close in Q4 usually started in Q1 or Q2.
A quarterly plan judged on the quarter's leads rewards capture, because capture converts inside the window, and starves creation, because creation converts in a later one. Over a year or two the team gets very good at bidding on the 5% while the cost of that 5% keeps climbing, because nobody has been talking to the other 95%. It's like judging a sowing by the harvest at week twelve and deciding to plant less. Scalewell builds the planning side of this with demand gen teams, so the team sees pipeline created alongside pipeline captured and plans each quarter from both.
Four things have to exist before the planning cycle starts
Four things have to exist before AI can help with any stage of B2B demand generation planning, and none of them is a model.
- Ad and campaign data connected to the CRM down to the opportunity. If an opportunity has no source, no tool can tell you which channel created it. AI lead scoring for demand gen covers how to connect paid data to lead quality once this link exists.
- One definition of pipeline that sales, marketing and finance all sign. The CMO Survey from Duke University found that the share of marketing and finance teams working together on growth had risen from 29.9% to 49.5% over three years, which the authors still call modest (The CMO Survey 2026). About half of marketing teams still set the growth number without finance in the room, which is where the pipeline definition usually gets lost.
- An ICP written from closed-won and closed-lost deals, with the disqualifiers spelled out, so that "qualified" means the same thing to the model and to the sales lead.
- A baseline cost per opportunity by channel for the trailing two or three quarters. Cost per lead will do for a week, and it will mislead you for a year.
This is the unglamorous part, and we'd rather say so than pretend a prompt fixes it. As of November 2026, any AI client you could put in front of a planning team, whether a chat assistant reading exports or an agent connected to the ad platforms, reads whatever the CRM says. It can summarize that data in minutes, and it cannot repair it.
Annual planning: work backwards from the revenue target, and let AI build the scenarios
Annual planning starts with the revenue number marketing is accountable for and works backwards to the pipeline, the opportunities and the budget that number requires. The steps below each end in something you can put in front of a CFO.
- Do the reverse math. Imagine Company A needs $12M in new annual recurring revenue at a $60,000 average contract, so 200 won deals. At a 25% opportunity-to-win rate that is 800 sales opportunities. If marketing is expected to source 60% of them, marketing owes 480 opportunities. At last year's blended cost of $3,500 per opportunity, the program budget is $1.68M before people and tools. Every figure in that paragraph is invented to show the shape of the sum; each one is a line in your CRM, so the sum can be checked.
- Run the sensitivities. Ask what happens if cost per opportunity rises 20% because the easy keywords are saturated, or if the win rate falls because sales headcount shrinks. This is where AI earns its place at the annual stage. Give a model the CRM export and the assumptions and it will produce the scenario table, the break-even points and the assumptions that matter most, in an afternoon rather than a week.
- Split the budget between creating demand and capturing it. Capture has a ceiling set by how many people are searching, and you can size that ceiling from search volume and intent data. Put a floor under creation, because it gets cut first when the quarter looks tight, and it decides which vendor the buyer ranks first before they ever call.
- Choose the bets you will hold for the year. Two or three segment and channel bets, each with a leading indicator you'll read quarterly, such as new ICP accounts engaging, and a lagging one you'll read at year end, such as pipeline created. Writing down the leading indicator in advance is what stops the Q2 review from killing a bet on the lagging one.
- Ask the model to argue against the plan. The best use of AI at this stage is as the colleague who has read every win and loss note and has no budget to protect. Ask it where the plan assumes last year repeats, and which assumption would hurt most if wrong.
The target, the risk appetite and the choice of bets stay with you. A model can tell you that your deals took 233 days last year; it cannot tell you whether the board will wait that long.
Here is the leading indicator from step 4 written down for one bet, with invented figures. Imagine Company A's creation bet is a LinkedIn program aimed at 600 ICP accounts in a segment it has never sold to. The leading indicator is the number of those accounts that engaged with the program for the first time in the quarter, counted once per account however many people engaged, with a target next to it, say 120 a quarter. Qualified meetings with those same accounts come next, because they are the step between an account engaging and the pipeline line you will read at year end.
As of November 2026, LinkedIn Campaign Manager gives you the first count without extra tooling. Under Plan, the Companies view shows impressions, engagements and an engagement level for your target accounts, a level LinkedIn says is "calculated by adding the paid engagement rate and number of organic engagements" and set by comparison with other companies that serve ads on LinkedIn (LinkedIn). Export it as a CSV each quarter, count the accounts that went from no engagements to some, and take the meetings from the CRM. If new accounts are engaging and meetings follow at the rate the plan assumed, the bet is on schedule while pipeline created still reads zero.
Quarterly planning: move money on leading indicators, and leave the yearly bets alone
Quarterly planning re-allocates budget between channels on the evidence of the trailing two quarters, within limits set in the annual plan. The review reads cost per opportunity by channel, pipeline created by stage, qualified meetings with ICP accounts, and creative fatigue, and it does not reopen the bets.
We'd set a rule like this: a quarterly review may move a fixed share of the budget, say 10% to 20%, between channels, and it may not cut a demand creation bet before that bet has run for a full buying cycle. Argue with the number; the principle is that you chose the bets with more information and less panic than you have in week two of a quarter.
AI builds the quarterly pack. It pulls the quarter's results from the ad platforms and the CRM, writes the variance against plan, and drafts three re-allocation options with the trade-off of each. Platform forecasts belong here too. Google Ads Performance Planner, for example, projects monthly and quarterly performance for eligible campaigns, with forecasts "refreshed daily and based on the last 7-10 days, adjusted for seasonality" (Google Ads Help). It forecasts the account's own conversions, so pair it with the CRM before you read a conversion forecast as a pipeline forecast. AI media planning goes further into what these tools do well and where they still need you.
There's a louder view in the market right now. Abhishek GP, SVP of growth and brand at Everstage, told G2 in February 2026 that "Teams winning right now don't plan demand by quarter" (G2). We half agree. Re-rank accounts continuously, yes, because intent changes weekly. Re-plan the bets continuously, no, because a 10-month buying cycle means a continuously re-planned program never finds out whether any bet worked. Adam Kaiser of 6sense put the workable version in the same piece: "Quick adaptation requires flexible planning cycles, with regular check-ins and room to adjust based on real-time buyer signals."
| Cadence | Decision | Data it needs | AI does | You decide |
|---|---|---|---|---|
| Annual | Target, pipeline math, creation vs capture split, two or three bets | Closed-won and closed-lost, win rates, cost per opportunity by channel | Scenario tables, win and loss synthesis, red-team review of assumptions | The target, the bets, the risk you'll carry |
| Quarterly | Re-allocation within limits | Trailing two quarters of cost per opportunity, pipeline by stage, leading indicators per bet | Variance pack, three options with trade-offs, platform forecasts read against CRM | Which option, and whether a bet gets more time |
| Weekly | Waste removal and anomaly response | Search terms, placements, daily spend, new ICP accounts engaging | Flags, negative keyword lists, draft notes to sales | Anything that moves budget above an agreed threshold |
Weekly: AI watches the pacing and the signals, and you decide what changes
The weekly check keeps the quarter on plan and catches waste early, and it is the stage where AI can run most of the work on its own. Pacing against budget, search term reviews, placement exclusions, cost per lead spikes read against cost per opportunity, and a list of ICP accounts that started engaging this week can all be prepared by a well-configured assistant or agent before Monday's stand-up.
AI flags, drafts and proposes; a budget change above an agreed threshold waits for a person. What AI agents can realistically run in a paid media team sets out which weekly jobs are ready for an agent as of November 2026 and which still want a human on the account.
Where AI-assisted planning goes wrong
AI-assisted demand generation planning fails most often on the inputs, and the surveys of marketing leaders say the same thing from several directions.
The data is less ready than the budget. Gartner's 2026 CMO Spend Survey of 401 CMOs and marketing leaders found CMOs allocating an average of 15.3% of marketing budgets to AI while only 30% reported mature or fully developed readiness to scale those capabilities (Gartner). The CMO Survey of 308 marketing leaders, fielded in January 2026, found generative AI used in 22.4% of marketing activities, up from 7.0% in 2024, and named technology integration and data architecture (19.1%) among the biggest barriers to getting value from marketing technology (The CMO Survey 2026). Usage is rising faster than the plumbing that makes it useful, and a model planning from a CRM where, say, 40% of opportunities carry no source will plan confidently around the 60%.
The model optimizes toward the number it can see. Give an AI last quarter's leads and ask what to do more of, and it will recommend more of whatever made leads. The report that shows 400 leads and leaves out what sales did with them predates AI; AI just produces it faster. Feed it opportunities and cost per opportunity instead, and ask it the question you'd want answered in the budget review.
Re-planning too often. Weekly data is noisy, and a model given nothing but the last four weeks will tell you to chase last month. Keep the weekly loop for pacing and waste, the quarterly loop for re-allocation, and the annual loop for bets, because each loop's data is the right length for its decision.
Reading a forecast as a measurement. A platform forecast or a model's projection is built from your own history. It is useful for pacing and dangerous as proof. The measurement is the opportunity in the CRM with a source on it.
Forgetting the buyer has an AI too. Gartner's survey of 646 B2B buyers, fielded August to September 2025, found 45% had used AI tools during a recent purchase and 67% preferred a rep-free experience (Gartner). Demand creation now has to work inside AI answers too, so give it a line in the annual plan with its own leading indicator.
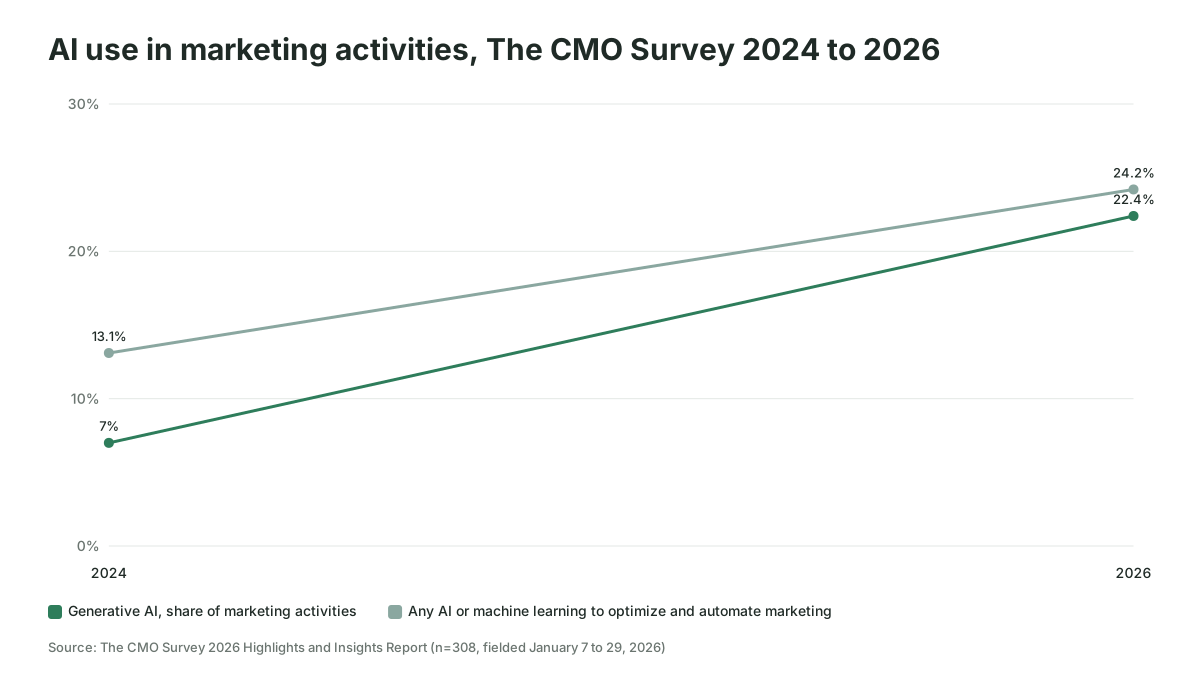
The strategy is working when cost per opportunity holds while pipeline rises
A demand generation strategy is working when cost per opportunity by channel is falling or holding while pipeline created is rising, and when a growing share of that pipeline traces back to demand you created rather than demand you captured. Those are the three lines the CFO should see every quarter, with win rate by source and time from first touch to opportunity underneath them.
The opportunity line matters more than the lead line. Two campaigns with almost the same cost per lead can cost very different amounts per opportunity once their leads are matched to the CRM, and nothing in the lead report will show the difference.
Give the creation bets their full cycle before you read their lagging number, and read the leading one from the annual plan in the meantime. If the leading indicator is moving and the lagging one isn't yet, the plan is working on schedule. If neither moves for a full buying cycle, cut the bet.
Where to start
Start with the four prerequisites, because the planning cycle cannot run without them, and build the annual reverse math as soon as the CRM link holds. If you'd like help setting up the planning cycle and the AI tooling around it for your team, Scalewell does that work.
Frequently asked questions
How often should a demand generation strategy be updated?
Set the demand gen strategy once a year, re-allocate budget once a quarter within limits you fixed at the annual stage, and adjust pacing weekly. B2B buying cycles averaged about 10 months in 6sense's 2025 study, so a bet re-planned every month never runs long enough to be judged. Re-rank target accounts as often as the signals change.
How much of a demand generation budget should go to creating demand versus capturing it?
There is no credible published split that applies across companies, and a split quoted by an agency usually describes its own clients. Size capture from search volume and intent data first, because it has a ceiling, then put a protected floor under creation. The Ehrenberg-Bass finding that about 5% of buyers are in market in a quarter is the reason the floor exists.
Can AI write a demand generation strategy?
AI can draft most of the document and build every scenario table in it, given your CRM data, win and loss notes and assumptions. It cannot set the revenue target, choose the bets you will hold for a year or decide how much risk the board will carry. Treat it as the analyst who has read everything and argues back.
How do you present a demand generation strategy to a CFO?
Lead with the reverse math: revenue target, win rate, opportunities needed, cost per opportunity by channel, budget. Show the leading indicators you will report each quarter and the date each bet will be judged on pipeline. Finance teams that have agreed the pipeline definition up front rarely argue with the budget later.