AI marketing analytics for paid teams: what it can answer and what it needs first
AI can answer questions, flag anomalies and write the narrative for a paid team, but benchmarks show the definitions under the model decide whether the answers are right.

AI marketing analytics is the use of language models and machine learning to answer questions about marketing data, flag unusual changes and write up what happened. For a paid team it works when the model reads ad spend already joined to CRM pipeline under written definitions, and it gives confident wrong answers when it does not.
You've probably seen the demo. Someone types "which campaigns drove pipeline last quarter?" into a chat box and a tidy chart appears. Then you try it on your own accounts, and the answer counts form fills as opportunities, mixes two date ranges and calls a LinkedIn campaign your best performer because it had the most leads. The demo had a clean model of the data behind it, and your stack has three tools that each define "conversion" differently.
This guide is for the CMO, VP of Marketing or head of demand gen deciding what to buy or build. It covers what AI does in paid media analytics, why the definitions under the model matter more than the model, which questions to hand over, the data work that comes first, and the tool categories as of November 2026. If you want the weekly report itself automated, that's a narrower job, and our PPC reporting guide walks through it step by step.
AI does three jobs in paid media analytics
AI marketing analytics for a paid team comes down to three jobs: answering questions in plain language, spotting changes worth a look, and writing the narrative around the numbers. Each one is already built into tools you probably pay for, and each needs something different underneath it.
| Job | What it looks like | Built-in examples as of November 2026 | What it needs underneath |
|---|---|---|---|
| Question answering | "What did cost per opportunity do on LinkedIn this quarter?" | Looker Conversational Analytics, Snowflake Cortex Analyst, HubSpot Breeze Assistant on reports | Spend and CRM outcomes in one place, with metrics defined once |
| Anomaly detection | An alert that Search conversions fell outside their normal range on Tuesday | GA4 anomaly detection, Google Ads explanations | Enough clean history to know what normal looks like |
| Narrative | A paragraph explaining what moved and why, written for the leadership team | HubSpot Breeze report summaries, any assistant reading a finished table | Finished figures the model can read but never has to compute |
The anomaly tools are the most mature of the three, because they are statistics with a language layer on top. Google Analytics 4 forecasts each value from past data and flags it "if the actual value falls outside the credible interval," training on 90 days of history for daily anomalies and 32 weeks for weekly ones. Google Ads explanations "give you insights into large changes in your Google Ads account performance" when you compare two date ranges, for Search, Performance Max, Demand Gen, Display, Video and App campaigns, within the last 90 days.
Notice what both of those see: one platform's own data. They can tell you that LinkedIn leads dropped. Neither can tell you whether the leads you lost were ever going to become pipeline, and that's the question your CFO asks. With spend and pipeline in one place under written definitions, the team can finally answer that question, and Scalewell helps paid teams build that groundwork before any assistant starts answering.
Accuracy depends on the definitions under the model more than on the model
The single best predictor of whether an AI analytics tool gives right answers is whether your business definitions are written down in a layer the model can read, such as a semantic layer, a modeled table or a metrics glossary. The strongest public evidence comes from a benchmark that has now been run twice, three years apart.
In 2023, Juan Sequeda, Dean Allemang and Bryon Jacob at data.world tested GPT-4 on 43 business questions over an enterprise insurance database schema. Asked directly against the SQL tables, it reached 16% accuracy. When the same questions went through a layer that described what the tables meant, accuracy rose to 54%. data.world sells that kind of layer, so read it as a vendor's study, but the method is public and others have rerun it.
dbt Labs reran the benchmark in April 2026 with current models, running each of 11 questions 20 times. On the original unmodeled tables, Claude Sonnet 4.6 writing SQL directly got 64.5% right. After an LLM built three joined models over the data, the same approach reached 90.0%, and asking through the dbt Semantic Layer reached 98.2%. GPT-5.3 Codex scored 84.1% and 100% on the modeled setup.
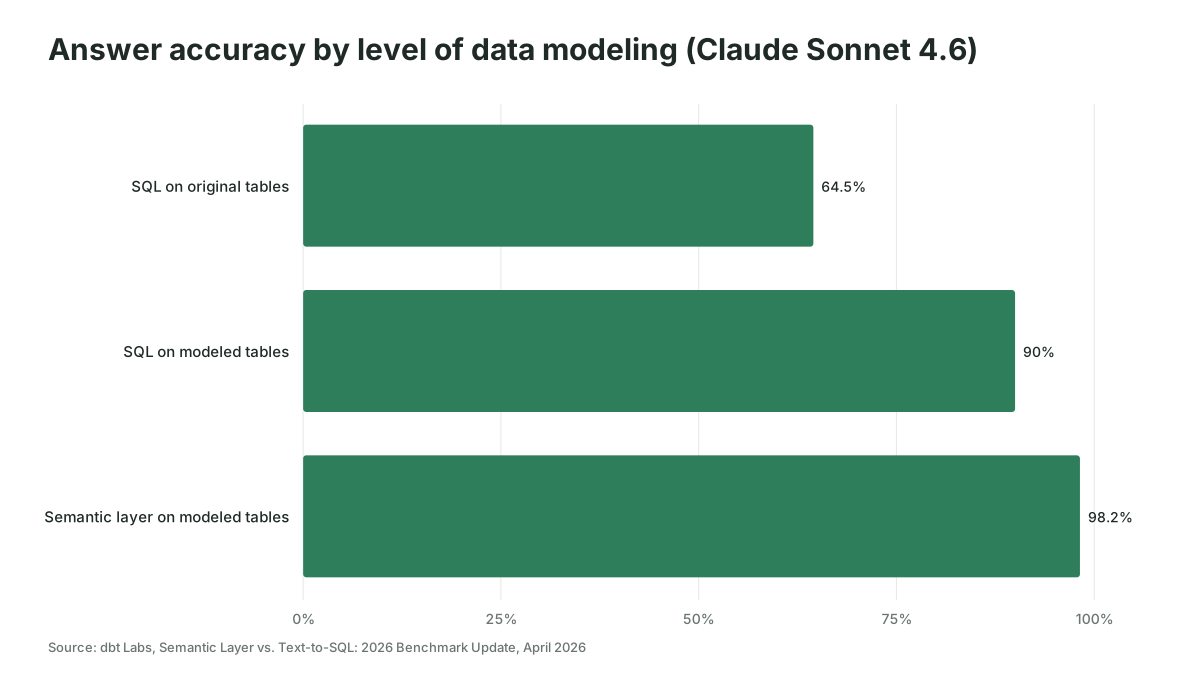
So what does that change for you? With the same model and the same questions, modeling the data added 33.7 points of accuracy. A team that buys the newest assistant and points it at raw exports leaves that gain on the table.
The authors are also clear about the failure you should fear. Text-to-SQL "can attempt any question as long as the data exists," they write, but "that flexibility comes with a real cost: it will sometimes give you plausible, wrong answers." A defined layer behaves differently: "When it can't, it tells you. It never silently returns wrong data." Google's own Looker documentation carries the same warning, that the feature "can generate output that seems plausible but is factually incorrect."
One caution on benchmark headlines. The Spider 2.0 leaderboard now shows agents above 90% on one of its three task sets, up from the 21.3% the best system solved in the original paper. A leaderboard score measures the benchmark's databases, not yours. Your HubSpot export with a field called "Lead Source (old) DO NOT USE" is a different test.
Hand AI the questions your joined data can answer
A simple rule decides which questions to give an AI analytics tool: if the answer is a sum over data you already hold and have defined, AI can answer it; if the answer needs a cause or a forecast, it needs an experiment or a model first. We'd sort every question your team asks into one of four rungs.
| Rung | Example question | Data it needs | Who should answer it |
|---|---|---|---|
| 1. Platform facts | "What did we spend on Google Ads by campaign last month?" | One platform's data | AI, with built-in tools or a connector |
| 2. Joined facts | "What's our cost per opportunity by LinkedIn campaign?" | Spend joined to CRM opportunities under one definition | AI, once the join and definitions exist |
| 3. Diagnosis | "Why did cost per opportunity rise in October?" | Joined facts plus change history and anomaly flags | AI drafts the likely causes, a person confirms them |
| 4. Cause and forecast | "What happens to pipeline if we move $20K from Meta to LinkedIn?" | Experiments or a marketing mix model | A test or a model, with AI helping to run it |
Most of the value for a B2B paid team sits on rung 2, and most of the disappointment comes from asking rung 4 questions of a rung 1 setup. An assistant asked "what if we moved budget?" will answer, fluently, from correlations in last quarter's data. That answer belongs in a hypothesis list, never in a budget memo. For rung 4, marketing mix modeling with AI and the guide to what AI changes about B2B attribution cover the methods that can carry the weight.
Rung 2 is where a real number changes a budget. Cost per opportunity by ad often ranks ads differently from cost per lead, and no platform dashboard shows that gap, because no platform dashboard knows which leads became opportunities.
The B2B marketing analytics foundation is a CRM join and one written conversion definition
AI marketing analytics needs two things before any tool is worth buying: ad clicks joined to CRM records, and a written definition of each number you report. Both are dull, and both take longer than the tool rollout. That's normal.
Gartner found the same blocker before generative AI arrived. In its 2022 survey of 377 marketing analytics users, only 53% of marketing decisions were influenced by data, and inconsistent, hard-to-access data was among the top reasons. A chat box on top of inconsistent data makes the inconsistency faster to reach.
Here is the order we'd do the work in:
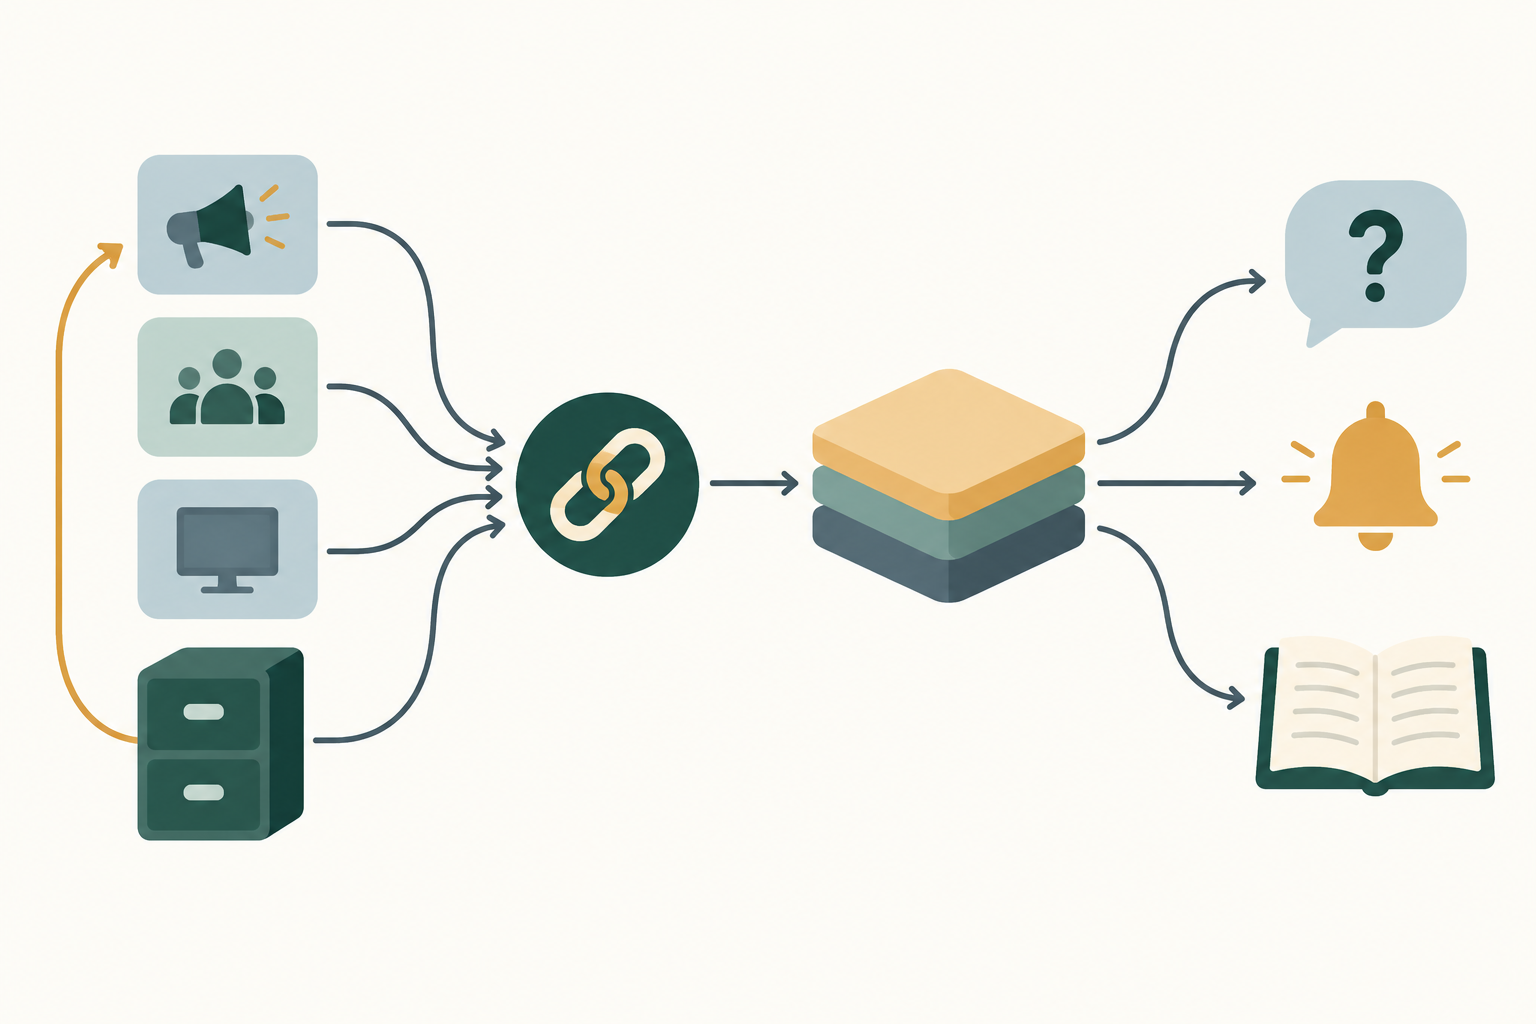
- Capture the click in the CRM. Store the Google click ID and UTM values on every lead and carry them onto the opportunity. Google's Salesforce setup guide asks for a read-only custom field named GCLID on both the lead and the opportunity, mapped so the click ID carries over when a lead converts. You end with a CRM report showing, for each opportunity, which campaign brought it in.
- Send outcomes back to the platforms. Google's enhanced conversions for leads "is an upgraded version of offline conversion import," and Google says those uploads move to the Data Manager API starting June 15, 2026. On LinkedIn, the Revenue Attribution Report connects Salesforce, Dynamics 365 or HubSpot through Business Manager and reports pipeline amount, revenue won and return on ad spend, with a lookback window you set between 30 and 365 days. This step is complete when each platform shows pipeline next to spend.
- Write the definitions down. Decide in one document what counts as an opportunity, which date it belongs to (created date or close date), which currency, and how you treat a deal touched by three campaigns. You end with a one-page metrics glossary that sales and finance have agreed to.
- Put the definitions where the model reads them. That could be a dbt Semantic Layer, LookML in Looker, a Snowflake semantic view or, for a smaller team, one modeled table per metric with the glossary attached to the assistant's instructions. The result is a single place where "cost per opportunity" is calculated, so every tool returns the same figure.
- Build a test set of questions with known answers. Write 15 to 20 questions your team asks every month and record the correct answer from finance or the CRM. Snowflake's Cortex Analyst documentation describes the same idea as "verified queries," sample questions with their SQL answers used to guide and measure the model. You finish with an accuracy score you can rerun after every change.
Choose the tool category by where your joined data lives
AI analytics tools for paid teams fall into four categories as of November 2026, and the right one is the category that sits closest to wherever your spend and pipeline already meet. The table names examples confirmed in each vendor's documentation in November 2026, in no order of preference.
| Category | Examples | Sees | Suits |
|---|---|---|---|
| AI inside each platform | GA4 anomaly detection, Google Ads explanations, HubSpot Breeze Assistant | One platform's data (HubSpot sees the CRM, so it sees outcomes) | Every team, at no extra cost, for rungs 1 and 3 |
| AI on your BI or warehouse | Looker Conversational Analytics (Gemini), Snowflake Cortex Analyst | Whatever you have modeled in the warehouse | Teams that already join ad and CRM data in a warehouse |
| General assistants with connectors | Claude or ChatGPT connected through MCP servers, such as the Google Analytics MCP server published under the googleanalytics GitHub organization | What each connector exposes, usually one source per connector | Teams without a warehouse who want rung 1 and 2 answers fast |
| Marketing data platforms with an agent | Improvado AI Agent and similar | The vendor's joined copy of your ad and CRM data | Teams that would rather rent the join than build it |
The decision rule follows the data. If spend and pipeline already sit together in a warehouse, put the AI there, because the definitions live there too. If they sit together nowhere, the first purchase is the join, either built or rented, and the assistant comes second. Connecting a general assistant to five separate sources gives you five answers to "how many opportunities."
For the connector route, the GA4 MCP guide covers what that server reads and writes. Its own documentation lists read tools such as run_report and run_funnel_report, plus a few write tools that need an explicit --allow-write flag.
AI marketing analytics fails on definitions and trust
AI marketing analytics fails in predictable ways, and almost all of them trace back to definitions or to trust rather than to the model. These are the ones we'd plan for.
- A plausible number nobody checked. The model answers a rung 2 question from rung 1 data and the figure looks reasonable. Without a test set, nobody notices until finance does.
- Two definitions of pipeline. The CRM counts opportunities by created date, the dashboard by close date, and the assistant picks whichever table it found first. You get two numbers in the same meeting and a long argument about which tool is broken.
- Alerts nobody reads. Anomaly detection flags whatever falls outside the expected range, including the Monday after a holiday. If every alert goes to a shared channel, the team soon learns to ignore the channel.
- Faster cherry-picking. In the same Gartner survey, about a third of respondents said decision-makers pick the data that supports a view they already hold. An assistant that answers any question in seconds makes that easier, so agree the questions before the meeting.
- Reading last week too early. In B2B, opportunities often arrive weeks after the click. An assistant summarizing last week's cost per opportunity on Monday is describing a number that will change.
Who should wait? If each campaign produces only a handful of opportunities a quarter, or your CRM attribution fields are mostly empty, the joined questions will not have enough rows to mean much. Fix the capture first and use the platforms' built-in tools in the meantime.
The setup is working when the test set passes and a budget decision changes
You can tell AI marketing analytics is working by three checks, in this order. The test set of known-answer questions scores close to perfect for four weeks running. The headline totals from the assistant match the CRM and finance's spend figures to the dollar. And at least one budget decision in the quarter was made on a rung 2 number, such as cost per opportunity by campaign, that the team could not have produced before.
The third check is the one to report upward. Hours saved on reporting are pleasant, but measuring AI's return in a paid team only counts them when they turn into cut spend or named work. A changed budget allocation is easier to explain to a CFO.
Where to start
Pick the five questions your leadership team asks every month, write down the correct answers and the definitions behind them, and see which rung each one sits on. That list tells you whether your next purchase is a tool or a join. If you'd like help setting up the definitions and the AI layer around how your team works, that's the kind of work Scalewell does with paid teams.
Frequently asked questions
What is the difference between AI marketing analytics and traditional marketing analytics?
Traditional marketing analytics needs a person to build each report and read each chart. AI marketing analytics lets you ask in plain language, flags unusual changes automatically and drafts the explanation. The underlying data and definitions are the same, which is why a team with weak definitions gets weak answers from both, only faster from AI.
Can ChatGPT or Claude do marketing analytics on my ad data?
Yes, for questions about data you give them. Through a connector or an uploaded file, a general assistant can summarize spend, compare periods and draft commentary. It works best when the figures are already calculated and the model only explains them. Joined questions about pipeline need CRM data in the same place, under one definition.
Is GA4 enough for AI marketing analytics in B2B?
GA4 covers website behavior and offers anomaly detection and predictive metrics, but it does not know which leads became opportunities or revenue. For B2B paid teams, GA4 answers rung 1 questions well. Pipeline questions need the CRM joined in, through offline conversions, the LinkedIn Revenue Attribution Report or a warehouse.
How much historical data does AI analytics need?
It depends on the job. Anomaly detection needs a stable baseline, and GA4's hourly model, the shortest, still learns from two weeks of history. Question answering needs no minimum history, only correct joins. Mix modeling needs far more: Meta's Robyn guide asks for "a minimum of two years of historical weekly data," which is why that work belongs to a model rather than an assistant.
Do I need a data warehouse for AI marketing analytics?
You can start without one. A team can answer platform questions with built-in tools and connectors today. A warehouse or a marketing data platform becomes necessary once you want joined answers across several ad platforms and the CRM, because the definitions need one home. Small teams can begin with one modeled table and a written glossary.