AI for B2B conversion rate optimization: getting qualified pipeline from paid landing pages
Most B2B landing pages can't conclude an A/B test, so this guide shows where AI helps CRO instead: a page-to-pipeline scorecard, research synthesis, test sizing and a pipeline readout.

B2B conversion rate optimization for paid landing pages means raising the share of paid clicks that become qualified opportunities, not form fills. Because most B2B pages get too little traffic for a classic A/B test to conclude, AI earns its place on the research, the hypotheses, the pre-test arithmetic and the pipeline readout, while auto-allocation features need careful handling.
Picture a meeting you've probably had. The demo page's conversion rate went from 3% to 5% after the new headline, everyone was pleased for two weeks, and then sales mentioned that half the new demo requests were students, competitors and one-person consultancies. The page converted better and the pipeline didn't move. Nobody did anything wrong, exactly. The page was being judged on the number it could see.
This guide is for the paid media lead who owns the landing pages that the ad budget points at. It covers how to measure each page on pipeline, the steps where AI saves real time, the arithmetic that tells you whether a test can conclude, what bandit and auto-allocation tools can and cannot do as of November 2026, and a short survey of tools with AI features. If you're building a page from scratch, our guide to B2B landing pages for paid traffic covers the page by funnel stage and offer; this one is about improving the pages you already run.
B2B CRO is measured in qualified pipeline per page
The number that matters for a B2B paid landing page is qualified pipeline per 1,000 paid clicks, with cost per opportunity next to it. A form fill is a step on the way, and a page can raise its form rate while lowering its pipeline, which is exactly what happened in the meeting above.
Landing page decisions get made on the opportunities each page produces, not its form rate, once AI takes over the page research and the pipeline readout, and that handover is what Scalewell helps paid teams make.
The table below is the scorecard we'd build first. It needs one thing most teams don't have: the landing page URL and the UTM values stored on each lead record in the CRM. A hidden form field that captures the page URL and the UTM parameters at submission does the job. Be careful with default properties here. HubSpot, for example, uses the full URL in its First page seen property to work out a contact's original source, which describes where tracking first picked the person up, not necessarily the paid page that converted them weeks later.
| Column | What it holds | Where it comes from |
|---|---|---|
| Landing page | One row per URL, variants listed separately | Hidden form field |
| Paid clicks | Clicks from paid campaigns to that page | Ad platforms, joined on UTM |
| Form rate | Form submissions divided by paid clicks | Analytics or the form tool |
| Qualified rate | Leads that reached your agreed qualified stage, divided by paid clicks | CRM |
| Opportunities | Opportunities created from those leads | CRM |
| Pipeline | Opportunity value created | CRM |
| Pipeline per 1,000 clicks | Pipeline divided by paid clicks, times 1,000 | Calculated |
| Cost per opportunity | Spend behind the page divided by opportunities | Calculated |
Once the joined export exists, the arithmetic is a good first job for an AI assistant that runs code. Our guide to AI marketing analytics covers the CRM join itself; this is the prompt for the page view.
Attached: (1) paid clicks and spend by landing page URL and UTM campaign for the
last 180 days, (2) CRM export of leads with landing page URL, UTM campaign,
lifecycle stage, opportunity created (yes/no) and opportunity amount.

Using Python:
1. Normalize URLs (strip query strings except utm_content) and join the files on URL.
2. Build one row per landing page with: paid clicks, spend, form rate, qualified
   rate, opportunities, pipeline, pipeline per 1,000 clicks, cost per opportunity.
3. Flag any page with fewer than 300 paid clicks as "too small to rank".
4. Rank the rest by pipeline per 1,000 clicks, and list separately the pages whose
   rank by form rate differs from their rank by pipeline by 3 places or more.
Show the code. Do not estimate any value that is missing; mark it missing.
The last list is the one to read. A page that sits high on form rate and low on pipeline is attracting the wrong people, and that's a different fix from a page nobody fills in.
Low B2B traffic means most landing page A/B tests can't conclude
A typical B2B landing page cannot reach a statistical verdict on a small change within a quarter, and on a qualified-lead metric it often can't reach one within a year. The arithmetic is worth seeing once, because it decides which of the steps later in this article you'll actually use.
Take a hypothetical demo page that receives 1,200 paid clicks a month, converts 4% of them into form fills and 1% into qualified leads. Evan Miller's rule of thumb for sample size per version, n = 16σ²/δ², works out to about 80% power at a two-sided 5% significance level, with lifts measured relative to the baseline (the creative testing guide walks through it). By that rule, a two-version test needs:
- 19,200 clicks, or about 16 months, to detect a 20% lift in form rate.
- 3,072 clicks, or about 2.6 months, to detect a 50% lift in form rate.
- 79,200 clicks, or about 66 months, to detect a 20% lift in qualified rate.
- 12,672 clicks, or about 10.6 months, to detect a 50% lift in qualified rate.
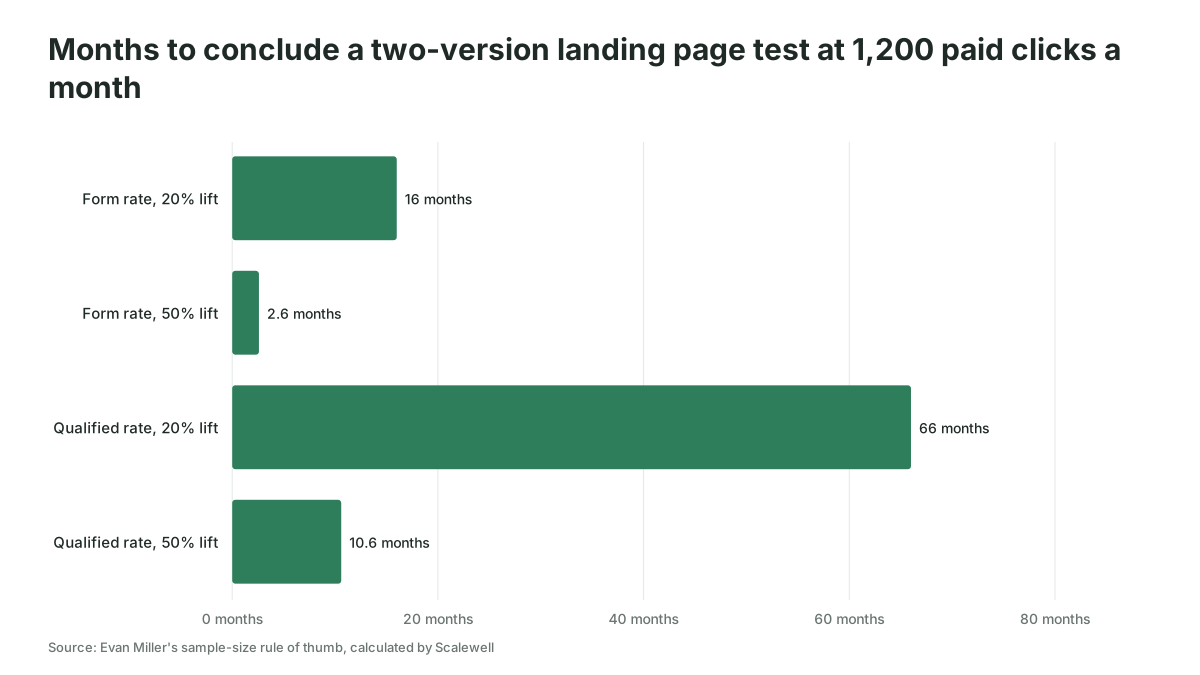
So the only tests this page can run are big ones, judged on form rate, with the pipeline check afterwards. A headline tweak is out. A different offer, a shorter path to a calendar booking or a page rebuilt around a different buyer is in. Conversion Rate Experts, a CRO consultancy, puts the low-traffic advice plainly in its guide: "Test the biggest, boldest ideas," and it notes that "a 100% increase can be detected about four times as fast as a 50% increase."
Who is this not for? If a page takes more than 20,000 paid clicks a month, you can test smaller changes properly and the limits in this section relax. Most B2B demo and pricing pages aren't there.
The method runs in six steps, with AI on research, review and reading
The steps assume three things are in place: the scorecard above, a qualified stage that sales has agreed in writing, and at least 90 days of paid traffic on the pages you'll work on. If the qualified stage is still an argument, our article on AI lead scoring covers how to settle it.
1. Pick the page that costs the most pipeline
Start with the page where paid spend is high and pipeline per 1,000 clicks is low, because that's where an improvement is worth the most money. Ask the AI to multiply each page's spend by the gap between its pipeline per 1,000 clicks and the median page's, and work down that list. One page at a time is plenty.
2. Summarize what qualified visitors did and said
AI is fast at reading the evidence nobody has time to read: session recordings, on-page survey answers and sales call notes. Microsoft Clarity, which its documentation describes as "a free service forever," has a Copilot feature that summarizes groups of recordings. In Clarity, go to Projects, then Recordings, select Summarize Recordings at the top right, and choose Top 10 recordings or Custom select. Clarity's filters include UTM campaign, so filter to the paid campaign first. Microsoft's own note applies to every tool here: generative models "can sometimes misinterpret or generate incorrect information," so click through to the recordings each point cites before you act on it.
For survey answers and call notes, a general AI assistant works well with this prompt.
Attached: (1) open-text answers from the on-page survey on [URL], (2) notes from
sales calls with leads who came from that page, marked qualified or disqualified.

1. Group the reasons people give for not converting, or for converting and then
   not qualifying, into no more than 8 themes. Count the answers in each.
2. Quote 2 verbatim answers per theme. Do not paraphrase inside quotation marks.
3. Separate themes from qualified leads and disqualified leads.
4. For each theme, say which part of the page it points at: offer, proof, form,
   price information, audience mismatch with the ad, or something else.
Do not recommend changes yet.
3. Review the page against the ad that sends traffic to it
A message match review compares what the ad promised with what the page delivers in its first screen, and a model can do it in seconds if you paste both. Paste the ad copy for the top three ads by spend, the page text, and your ICP in two sentences, then ask the model to list every promise in the ads, mark whether the first screen of the page keeps it, and name anything on the page that would attract someone outside the ICP. Our guide to the AI ad copy generator covers writing ads that make promises the page can keep.
Before the review, check the page's mobile-friendly click rate in the Google Ads Landing pages report, which our landing pages guide walks through, because a page that fails on mobile won't be fixed by a better headline.
4. Fix the form and the qualification logic before the copy
The form is often the biggest lever on qualified rate, because it decides who gets through and how much they tell you. AI helps in two places here: drafting a qualifying question that sales would actually use for routing, and checking past form answers against CRM outcomes to see which fields predict qualification and which only add friction. We could not find a credible, current public study of how form length affects B2B conversion, so treat any figure you see quoted as a hypothesis to test on your own page.
LinkedIn deserves its own decision here. Its Lead Gen Forms skip the landing page entirely and pre-populate form fields from the member's profile, so they ask far less of the person than a page form does, and our landing pages guide covers when the form beats a page. Compare a LinkedIn lead gen form campaign and a landing page campaign on qualified rate and cost per opportunity in the CRM, never on form rate.
5. Turn the evidence into one big hypothesis and size it
Give the AI the outputs of steps 2 to 4 and ask for three hypotheses, each naming the change, the evidence behind it, the metric and the lift it would need to show. Then size each one with the rule of thumb from the traffic section above, using your real clicks per month and baseline rate. Keep only the hypotheses that can conclude within about 8 weeks. If none can, you have three honest options: make the change bigger, raise traffic to the page for the test period, or ship the change on judgment and watch pipeline per 1,000 clicks for a full sales cycle against the page's own history. The last one isn't a test, so call it a change and don't report it as a win.
6. Read the result on pipeline, a sales cycle later
A test that wins on form rate has worked only when the winning version's qualified rate and pipeline per 1,000 clicks are at least as good as the control's once its leads have had time to progress. In practice, that means re-running the step 1 scorecard 60 to 90 days after the test ends, or longer if your sales cycle is longer, and logging the result next to the test.
AI A/B testing tools reallocate traffic, which is a different job from learning
Multi-armed bandits and similar auto-allocation features shift traffic toward whichever version converts best while the test runs, and they give up a clean verdict to do it. Optimizely's documentation says so directly: its bandits "aggressively push traffic to whichever variations are performing best," and "MABs ignore statistical significance, so the results page does not contain statistical significance." Unbounce describes its Smart Traffic feature as starting to route visitors "after as few as 50 visits," sending each visitor to the variant that has converted best for visitors "with similar attributes."
Both features optimize toward one goal: Optimizely's bandits use the experiment's primary metric, and Smart Traffic uses the page's conversions, which on a B2B page usually means the form submission. That's the catch: a bandit set to form fills will happily send more traffic to the version that attracts students, and it will do it faster than you'd notice. Use auto-allocation for short-lived pages where the form fill is a good proxy, such as an event registration, and keep a fixed-split test, read on pipeline, for the pages that carry your demo and pricing traffic.
A short survey of CRO tools with AI features
Several CRO tools now ship AI features, and each one does a narrow job. This is what each vendor's own pages said when we checked in November 2026. It's a survey, not a ranking, and prices beyond Clarity's should be checked on the vendor's pricing page.
| Tool | AI feature | What it does | Limits worth knowing |
|---|---|---|---|
| Microsoft Clarity | Copilot, Campaign Insights | Summarizes session recordings; Campaign Insights combines connected ad data with on-site behavior | Free; Campaign Insights needs UTM tags and typically 3 to 5 days of data |
| Optimizely | Variation Creation agent, multi-armed bandits | The Variation Creation agent builds an experiment's variations from a page URL and an instruction and returns preview links | Bandits report no statistical significance |
| Wingify (home of VWO and AB Tasty) | Wingz AI | A Hypothesis Agent turns evidence into ranked test ideas and drafts variations | Wingify says "Nothing goes live without your explicit approval" |
| Unbounce | Smart Traffic | Routes each visitor to the variant predicted to convert best for similar visitors | Optimizes to the page's conversions, usually the form |
| General AI assistants that run code | Analysis and synthesis | Build the scorecard, size tests, group survey and call-note themes | Only as good as the export and the definitions you give it |
Google's own free testing tool is not an option: Google Optimize and Optimize 360 were sunset on September 30, 2023. For which tasks to hand to AI across the rest of the paid program, our article on which paid media tasks to automate first gives a ranking.
Where AI conversion rate optimization goes wrong
Most failures come from optimizing the number the tool can see. Four patterns account for most of them.
- Optimizing to the form fill. Whatever a tool optimizes toward during the test, set the goal you report on to qualified rate before anyone looks at a result.
- Generating more variants than the traffic can judge. AI makes ten page versions in a minute, and each extra version needs its own full sample. On the hypothetical 1,200-click page above, two versions is the limit.
- Personalizing until every segment is too small. Personalization by industry or company size splits a page's traffic further. Five segments on a 1,200-click page leave about 240 clicks each a month, which is enough to watch and nowhere near enough to test.
- Trusting a summary without the recordings. A Copilot summary that says "users struggle with the pricing table" is a lead to check, and it may be describing three sessions. Click through before you brief a redesign on it.
Skip formal CRO for now if your paid pages produce fewer than about 10 opportunities a quarter between them. Spend the time on the scorecard, the form and the message match review instead, and ship changes on judgment. You'll learn more from 90 days of pipeline per 1,000 clicks than from a test that never concludes.
Start with the page-to-pipeline table
Add the landing page URL and UTM values to your forms this week, and in 90 days run the scorecard prompt to find the page costing you the most pipeline. Scalewell works with paid teams to set this loop up as a recurring AI job, so the team spends its time on the changes worth making.
Frequently asked questions
What is a good conversion rate for a B2B landing page?
There is no credible single benchmark, because published figures mix different traffic sources, offers and definitions of a conversion. Compare each page against your own pages instead, on qualified rate and pipeline per 1,000 paid clicks. A page with a 2% form rate and a high qualified rate can be worth more than one at 8%.
Can AI run landing page A/B tests on its own?
AI features can now draft variations, set up experiments and shift traffic, as Optimizely's Variation Creation agent and Unbounce's Smart Traffic show. What they cannot do is decide what counts as a good lead or wait a sales cycle to check it. Keep a person on the goal, the hypothesis and the pipeline readout.
How much traffic do you need to A/B test a landing page?
It depends on your baseline rate and the lift you want to detect. With the rule of thumb above, a page converting 10% of clicks needs about 3,600 clicks per version to detect a 20% relative lift, and halving the baseline rate roughly doubles that number. Run the check before launch, and test bigger changes if the numbers come out too large.
Should I use LinkedIn Lead Gen Forms or send traffic to a landing page?
Run both for a full sales cycle and compare them on qualified rate and cost per opportunity in the CRM. Lead Gen Forms are prefilled from the member's profile, so they ask little of the person, while a landing page gives you room to explain the offer and qualify with your own questions. Choose the one that produces more pipeline per dollar for that offer.
Is personalization worth it for B2B landing pages?
Personalization by segment is worth it when each segment brings enough paid traffic to judge, or when the change is obvious, such as matching the page headline to the industry named in the ad. Below a few hundred clicks a month per segment, use one strong page per campaign and match the message to the ad instead.