Media plan template for B2B paid media, and how to fill it with AI in an hour
A complete, ungated media plan template for B2B paid media, with the assumptions table most templates skip, a worked hypothetical from pipeline target to channel budget, and the six-prompt sequence that fills it with an AI assistant in about an hour.

A media plan template is a set of tables that records what a paid campaign has to achieve, who it reaches, which channels get what share of the budget, when the money runs, how success is measured, and which assumptions the forecast rests on. The template below covers all seven and comes with the prompts that fill it with AI.
You probably know the moment this is for. Finance has asked for next quarter's paid plan by Friday, the last one lives in a spreadsheet with four tabs nobody trusts, and the CMO wants to know what the money will return before it is spent. You can copy a template from a project management vendor, but most of them give you columns for spend and dates and nothing that connects the spend to pipeline. With AI pulling the exports and drafting the assumptions, the plan reaches finance on time and holds up to questions, and Scalewell builds that planning routine with paid teams.
This article gives you a paid media plan template built for B2B teams, with the assumptions table most templates leave out, a worked example you can follow with your own numbers, and a prompt sequence that fills it with an AI assistant in about an hour once you bring the exports. It's written for the head of paid media or the PPC lead who has to produce the plan, and it stays useful when the CMO asks where a number came from.
Most media plan templates record spend and skip the assumptions
The free media planning templates that rank for this search share the same six parts: objectives, target audience, channel mix, budget allocation, a schedule, and KPIs. Smartsheet's set of six, ProjectManager's Excel file and HubSpot's paid media sheet all follow that shape. What none of them carries is a table of the assumptions behind the plan, such as expected click cost, conversion rate, lead to opportunity rate and win rate, with a source next to each one.
That gap matters more than it looks. A B2B paid plan is a chain of multiplications: budget divided by click cost gives clicks, clicks times conversion rate gives leads, leads times a qualification rate gives opportunities, and opportunities times win rate and deal size gives revenue. Every number in that chain is a guess until it has a source, and a template that doesn't record the guesses can't tell you which one was wrong when the quarter misses.
And this is the biggest line the CMO signs. In Gartner's 2025 CMO Spend Survey of 402 CMOs and marketing leaders, fielded in February and March 2025, with the figures here taken from MarTech's report on it, marketing budgets held at 7.7% of company revenue, and paid media took 30.6% of marketing budgets, or about 2.4% of company revenue. The sample skews to companies above $1 billion in revenue, but if you run paid for a $200 million company and the ratio holds, that's roughly $4.8 million a year passing through the plan you're about to write.
The template has seven tables, and the last one does the work
The template below is seven tables that reference each other. Fill tables 1, 2 and 7 first, then 3 to 6, because the budget in table 3 depends on the math in table 7, and the flighting in table 5 depends on the monthly split in table 4. The example rows describe a hypothetical company, which we'll call Company A: a B2B SaaS business selling a $40,000 a year product with a $300,000 paid budget for the quarter. None of those figures are benchmarks, so replace every one with your own.
Table 1: objectives, with the source that settles disputes
Table 1 states what the money must produce and which data source settles arguments about whether it did. The last row is the one teams skip, and it's the one that stops the "platform says 400 leads, CRM says 180" conversation in week nine.
| Field | What goes here | Company A (hypothetical) |
|---|---|---|
| Business goal | The revenue outcome the plan supports, in the words the CFO uses | $3M in new qualified pipeline for Q1 |
| Period | Start and end dates of the plan | Jan 5 to Apr 5, 13 weeks |
| Total paid budget | Media only, with agency fees, tooling and brand search listed separately | $300,000, with brand search held on its own line |
| Primary KPI | One metric the plan is judged on | Sales-accepted opportunities created |
| Target | The number the primary KPI must reach | 75 opportunities |
| Ceiling | The most you will pay per unit of the primary KPI | $4,000 per opportunity |
| Secondary KPIs | Two or three at most, in order of importance | Cost per qualified lead, pipeline value, share of target accounts reached |
| Hard constraints | Regions, excluded segments, brand rules, legal | North America only; no competitor keyword bidding |
| Deciding source | The system whose numbers win a dispute | CRM opportunity report, run on the first business day of each month |
Table 2: audience segments, each with a job in the plan
Table 2 names each audience segment, estimates its size, and gives it a job in the plan. The job column stops you from running a demo offer at people who have never heard of you. LinkedIn's B2B Institute, drawing on joint research with the Ehrenberg-Bass Institute, puts it bluntly on its 95-5 rule page: "95% of your potential buyers aren't ready to buy today." Your plan needs rows for both groups, and the budget split between them is a decision you should make on purpose.
| Field | What goes here | Company A, segment 1 (hypothetical) | Company A, segment 2 (hypothetical) |
|---|---|---|---|
| Segment name | A label the sales team would recognize | Target account buying committee | In-market finance leaders |
| Who | Titles, company size, industry | VP and director of finance, 500 to 5,000 employees, US software | Same titles, any company, searching for close management tools |
| Estimated size | From platform audience tools or your Total Addressable List | 1,200 accounts, about 9,000 people | Search demand of about 4,000 relevant queries a month |
| Buying stage | Out of market, in market, or open opportunity | Mostly out of market | In market |
| Job in this plan | Create demand, capture demand, or progress open deals | Create demand and build account coverage | Capture demand |
| Proof they are reached | The metric that shows coverage, before any conversion | Share of target accounts with 3 or more engaged people | Impression share on priority queries |
Table 3: channel mix, with a feasibility check per line
Table 3 splits the budget across channels and records why each channel is there. The feasibility column is the check most plans never run: does this line have enough budget to produce enough conversions for the platform to optimize and for you to judge it? Google's help page on Target CPA bidding says that for evaluation, "we recommend you measure performance for the last 30 days, including at least 30 conversions." A line that cannot reach 30 conversions a month at its planned cost per conversion is a test, and it should be labeled as one.
Brand search sits outside this table and outside the $300,000. People searching for your own name are often on their way to you already, and the published experiments disagree on how much a brand ad adds. eBay's field test by Blake, Nosko and Tadelis found that "brand-keyword ads have no measurable short-term benefits" for eBay, while Simonov, Nosko and Rao's experiments on Bing found a positive effect of 1 to 4 percent when no competitor was bidding on the name and a strongly positive return on defending it when one was. Wherever your brand line lands between those two results, counting it toward a pipeline target flatters the search rows in table 7, so give brand search its own budget, record it in the total paid budget row of table 1 as held separately, and judge it on impression share for your name and on cost per click rather than on cost per lead. Keep the demand lines clean with Google's brand settings, which, as of November 2026, let a Performance Max campaign, or a Search campaign with AI Max turned on, stop serving on "queries associated with a brand that you want to avoid," and Google's launch note confirms the excluded list can include "your own brand terms."
| Channel | Job (from table 2) | Share | Budget | Primary metric | Planned unit cost | Feasibility check |
|---|---|---|---|---|---|---|
| Google Search, non-brand | Capture demand | 40% | $120,000 | Qualified leads | $300 per lead | 400 leads a quarter, about 133 a month, clears 30 |
| LinkedIn Sponsored Content | Create demand in target accounts | 35% | $105,000 | Engaged target accounts | $600 per lead | 175 leads a quarter, about 58 a month, clears 30, but judged on account coverage because its job is demand creation |
| Meta, retargeting and lookalike | Capture and progress | 10% | $30,000 | Qualified leads | $400 per lead | 75 leads a quarter, 25 a month, below 30: a test line |
| Review sites and sponsored listings | Capture demand | 5% | $15,000 | Qualified leads | $350 per lead | Fixed-fee listings, judged on CRM-matched leads |
| Test reserve | Unassigned until a test wins | 10% | $30,000 | Decided per test | Decided per test | Released only against a written test brief |
| Total | 100% | $300,000 | Shares must sum to 100% |
Table 4: budget by month, shaped by platform pacing rules
Table 4 turns the channel budget into a monthly schedule, and it is where platform pacing rules bite. On Google Ads, a campaign "might spend up to twice your average daily budget" on a given day, but across the month you pay "no more than 30.4 times your average daily budget," according to Google's help page on average daily budgets. So the monthly figure you write here is what sets the daily budget in the account. If you set the daily budget to the month total divided by 30.4, a 28-day month lands about 8% under plan, and if you divide by 28 instead, the 30.4 cap lets the account spend about 8.6% over it, so pick one and write down which.
| Channel | Month 1 | Month 2 | Month 3 | Quarter | Notes |
|---|---|---|---|---|---|
| Google Search, non-brand | $36,000 | $42,000 | $42,000 | $120,000 | Month 1 lower while new ad groups learn |
| LinkedIn Sponsored Content | $30,000 | $37,500 | $37,500 | $105,000 | Two creative rotations, weeks 1 and 7 |
| Meta, retargeting and lookalike | $9,000 | $10,500 | $10,500 | $30,000 | Audiences fill from month 1 search traffic |
| Review sites and sponsored listings | $5,000 | $5,000 | $5,000 | $15,000 | Fixed fee, paid monthly |
| Test reserve | $0 | $15,000 | $15,000 | $30,000 | First test brief due end of month 1 |
| Total | $80,000 | $110,000 | $110,000 | $300,000 | Daily budget = month total divided by 30.4; check the 30.4x cap in a short month |
Table 5: flighting by week and spend shape
Table 5 says which weeks each line is live and what shape its spend takes. Three shapes cover almost every case: continuous (even spend), flighting (on and off in blocks) and pulsing (always on with planned peaks). For B2B demand capture, continuous is the default, because you don't control when a buyer searches. For demand creation, pulse around the moments you do control, such as a product launch or an event.
| Line | Shape | Live weeks | Peak weeks | Creative due | Owner |
|---|---|---|---|---|---|
| Google Search, non-brand | Continuous | 1 to 13 | None | Week 0 | Paid search lead |
| LinkedIn Sponsored Content | Pulsing | 1 to 13 | 3 to 4 and 9 to 10 (webinar and report launch) | Weeks 0 and 6 | Paid social lead |
| Meta, retargeting and lookalike | Continuous | 2 to 13 | None | Week 1 | Paid social lead |
| Review sites and sponsored listings | Continuous | 1 to 13 | None | Week 0 | Marketing ops |
| Test reserve | Flighting | 5 to 8 and 10 to 13 | By brief | Per brief | Head of paid |

Table 6: KPIs with thresholds and the action for each
Table 6 lists each metric with the number it must reach, where you read it, how often you check, and what you do when it drifts. Writing the action down in advance is what makes the weekly review a ten-minute job rather than a debate. The thresholds here are hypothetical starting points, and the review cadence pairs with the pacing check described in our article on automating PPC budget pacing checks with AI.
| Metric | Plan | Source | Cadence | Action threshold | Action |
|---|---|---|---|---|---|
| Spend vs plan | 100% of month | Platform billing | Weekly | Below 85% or above 110% of plan to date | Diagnose delivery before touching budgets |
| Cost per qualified lead | $300 search, $600 LinkedIn | CRM, matched to campaign | Weekly | 25% above plan for two consecutive weeks, with 30 or more leads in the window | Move up to 10% of that line's budget to the best-performing line |
| Sales-accepted opportunities | 25 a month | CRM opportunity report | Monthly | Below 80% of plan | Review lead quality with sales before adding spend |
| Cost per opportunity | $4,000 ceiling | CRM plus platform spend | Monthly | Above ceiling for a full month | Pause the worst line's lowest-performing audience |
| Target account coverage | 60% of 1,200 accounts engaged | LinkedIn and CRM | Monthly | Below 50% at end of month 2 | Widen creative, not audience |
| Frequency, paid social | Within platform guidance | Platform | Weekly | Above the ceiling you set | Rotate creative first, release budget second |
Table 7: assumptions, each with a source and a confidence level
Table 7 is the engine. Every number in tables 3, 4 and 6 should trace back to a row here, and every row here needs a source and a confidence level. When the quarter ends, this is the table you update, because the assumptions were wrong long before the budget was.
| Assumption | Value | Source | Confidence | Last checked |
|---|---|---|---|---|
| Average CPC, Google non-brand | $12 | Last two quarters' account data, plus Keyword Planner forecast | High | Plan date |
| Landing page conversion rate, search | 4.0% | Last quarter's account data | High | Plan date |
| Average CPC, LinkedIn | $9 | Last quarter's Campaign Manager data | Medium | Plan date |
| Form conversion rate, LinkedIn | 1.5% | Last quarter, lead gen forms | Medium | Plan date |
| Lead to sales-accepted opportunity | 15% | CRM, trailing six months | Medium | Plan date |
| Opportunity to close | 25% | CRM, trailing twelve months | Medium | Plan date |
| Average contract value | $40,000 | Finance | High | Plan date |
| Sales cycle | 90 days | CRM | High | Plan date |
| Seasonality, Q1 vs Q4 | Search demand up 10% | Last year's impressions by month | Low | Plan date |
The confidence column tells your AI assistant, and your CFO, which rows to argue about. A plan with eight high-confidence rows and one low-confidence row is a plan with one known weak point, which is a much better position than a plan with nine unlabeled guesses.
Work the budget backwards from pipeline before you split it by channel
The budget in table 3 should come out of tables 1 and 7, in that order, rather than being inherited from last year and split by habit. For Company A, the chain runs like this, and every figure is the hypothetical one from table 7.
- Pipeline target of $3M at an average contract value of $40,000 means 75 sales-accepted opportunities.
- At a 15% lead to opportunity rate, 75 opportunities need 500 qualified leads.
- A $300,000 budget divided by 500 leads sets a blended ceiling of $600 per qualified lead, and $300,000 divided by 75 sets the $4,000 per opportunity ceiling in table 1.
- Search at $12 CPC and 4% conversion gives a planned $300 per lead, so $120,000 buys about 400 leads. LinkedIn at $9 CPC and 1.5% conversion gives $600 per lead, so $105,000 buys about 175. Meta at $400 per lead buys about 75, and listings about 43. That's roughly 690 leads against a need of 500, which gives the plan room for the assumptions to be optimistic by more than a quarter.
- Now run the feasibility check in the last column of table 3 for each line: planned leads a month against the floor of 30, with any line under it labeled a test and any demand creation line judged on account coverage instead.
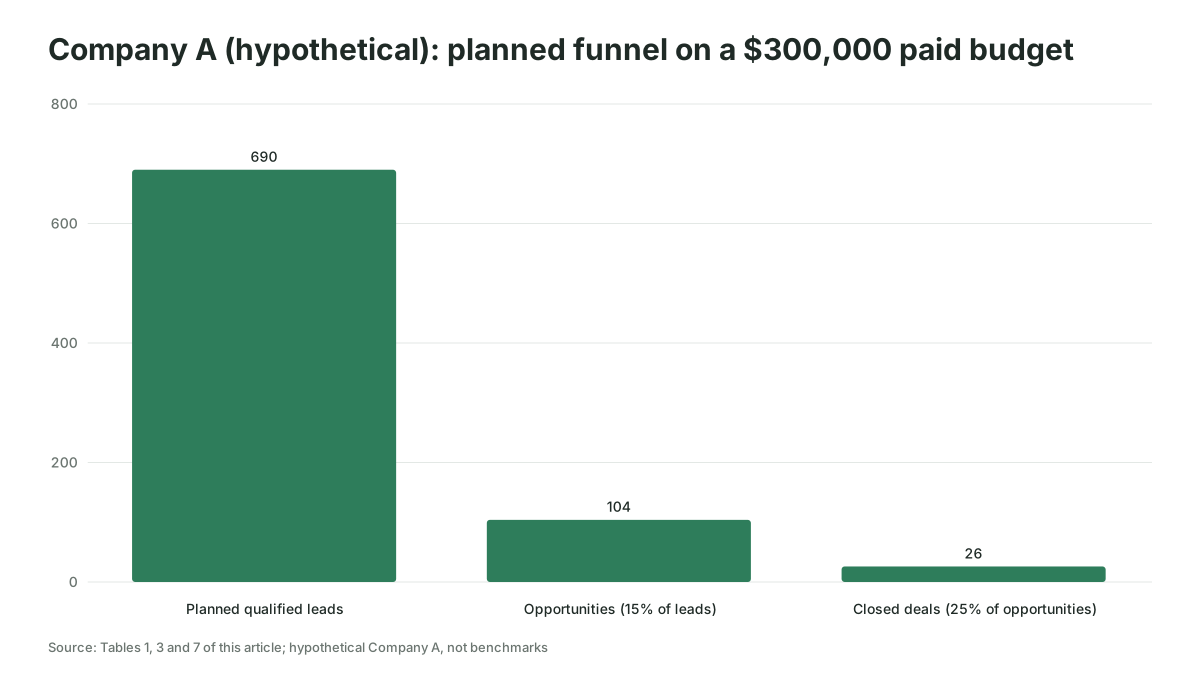
Step 4 is where most plans flatter themselves. If you write $300 per lead for search because that is what the account did last quarter, you are assuming the next $120,000 behaves like the last $90,000, and the marginal lead usually costs more than the average one. Put that in the assumptions table as a stated risk rather than hiding it in the total.
Platform minimums are the other feasibility check. LinkedIn's help pages state that "a minimum unspent budget of $100 USD, or equivalent currency, is needed to launch a new ad set" and that "the minimum ad set audience size is 300 member accounts", where members means people, so a tier one list has to match at least 300 people after titles and location are applied, which a short company list often will not. Meta's Marketing API ad set reference describes a learning stage for each ad set during which delivery is less stable, so give a Meta line time to leave that stage before you judge its numbers. Neither of those is a reason to drop a channel, but each is a reason to write the constraint into table 3 before someone finds it in week two.
If you want the thinking behind the channel split itself, rather than the arithmetic, our article on building a paid media strategy for an AI-assisted team covers how the strategy sets the roles each channel plays here.
Filling the template with AI takes about an hour if you bring the exports
An AI assistant can fill this media plan template in about an hour of your time, provided you give it the data instead of asking it to guess. The hour splits roughly into fifteen minutes exporting, forty minutes running the six prompts below and correcting the output, and five minutes reading the assumptions table before you send it anywhere. Nothing in this section needs an API connection or a developer.
Before the first prompt, gather four files: last quarter's campaign performance by month from each ad platform as a CSV, a CRM export of leads with their source campaign and whether they became an opportunity, your calendar of launches and events for the period, and last year's plan if one exists. As of November 2026, Anthropic's help center lists CSV and XLSX among the file types you can upload to Claude, with XLSX needing code execution and file creation turned on in your account, and the same page notes that Claude extracts text only from those files, so remove charts and merged header rows first. Other assistants have equivalent upload features, and the prompts below do not depend on which one you use.
For the forecast inputs, use the platform's own tools rather than the model's memory. Google Ads Performance Planner produces forecasts that are "refreshed daily and based on the last 7-10 days, adjusted for seasonality," and its campaign eligibility rules and scope are on Google's help page, which also notes that from March 9, 2026 it no longer covers Display and Video campaigns. Keyword Planner's forecasts take "your bid, budget, seasonality, and historical ad quality into account," per its help page. Export those, and paste the figures into the conversation as inputs.
Run the prompts in order, in one conversation, and keep the first one as the standing rules for the rest.
Prompt 1: rules and context
You are helping me write a quarterly paid media plan for a B2B company. I will upload exports and tell you the business goal. Rules for the whole conversation:
1. Never invent a number. Every figure you write must be labeled with one of three sources: "from file" (with the file name and column), "from platform tool" (I will paste these), or "assumption" (your estimate, with the reasoning).
2. If a value is missing, write "MISSING" and ask me for it instead of estimating.
3. Show your arithmetic in full whenever you multiply or divide.
4. Use US dollars and a 13-week quarter unless I say otherwise.
Context: [paste the business goal, period, total budget, regions, constraints and the deciding data source from table 1].
Confirm you understand and list the files you expect from me.
Prompt 2: derive the assumptions from the exports
Attached are last quarter's performance exports by month from [platform names] and a CRM export of leads with source campaign and opportunity status. From these files only, calculate for each channel: average CPC, click to lead conversion rate, cost per lead, lead to opportunity rate, and the number of leads and opportunities per month. Then produce an assumptions table with the columns: assumption, value, source (file and column), confidence (high if based on 100 or more leads, medium if 30 to 99, low below 30), last checked (today). Flag any month that looks like an outlier and say why.
Prompt 3: work the budget backwards
Using the assumptions table, the platform forecasts I am pasting here [paste the Performance Planner and Keyword Planner figures, labeled "from platform tool"] and this quarter's pipeline target of [value] at an average contract value of [value], calculate: the number of opportunities needed, the number of qualified leads needed at the lead to opportunity rate, the blended ceiling per lead and per opportunity at a budget of [value], and the planned leads per channel if the budget were split [your intended shares]. Then run a feasibility check per channel: planned conversions per month against a floor of 30, and state which lines are tests. Show every calculation.
Prompt 4: channel mix and monthly split, two ways
Produce two versions of the channel mix and monthly budget tables. Version A: the split I gave you. Version B: the split you would recommend from the assumptions, with a 10% test reserve. For each version give share, budget, primary metric, planned unit cost and the feasibility result, then a month by month table with a ramp in month 1 where a line is new. Explain each difference between A and B in one sentence that refers to a specific assumption row. Do not recommend a channel that does not appear in my exports unless I asked for it.
Prompt 5: flighting against the calendar
Here is our calendar for the quarter: [paste launches, events, holidays, sales kick-off, blackout dates]. Build the flighting table: line, shape (continuous, flighting or pulsing), live weeks, peak weeks, creative due date and owner. Demand capture lines default to continuous. Demand creation lines pulse around calendar moments. Set creative due dates at least one week before each peak. Then adjust the monthly budget table so that month totals still match and daily budgets are stated as month total divided by 30.4, with a note on the spending cap for any month shorter than 30 days.
Prompt 6: KPI thresholds and the honesty check
Build the KPI table: metric, plan value, data source, review cadence, action threshold and the action to take, using the deciding data source for anything that involves opportunities. Then, as a final step, list every number in the entire plan that is labeled "assumption" rather than "from file" or "from platform tool", in order of how much the plan's outcome depends on it. For each one, say what data would turn it into a "from file" number.
The final step of prompt 6 is the part people skip, and it's the reason the hour is worth it. The model will hand you a ranked list of the places it guessed, which is more than most human-written plans admit to.
AI gets a media plan wrong in three predictable ways
An AI assistant fills a media plan template quickly and gets the same three things wrong often enough that you should check for them every time. None of them is a reason to go back to filling the sheet by hand, and all three are caught by the rules in prompt 1 if you hold the model to them.
The first is invented benchmarks. Ask a model for a typical B2B LinkedIn cost per lead and it will usually give you a confident figure with no sample, no date and no source, because the question asks it to guess and it is built to answer. The fix is the source column from prompt 1. If a number has no file behind it, treat it as a placeholder, however plausible it looks.
The second is arithmetic drift. Over a long conversation, a model can carry a share of 35% in one table and a budget that implies 38% in the next, especially after you have changed one input. Ask it to recompute totals after every edit and to show the sum of the shares, and read the totals yourself before anyone else does. A spreadsheet checks that a column adds up; a chat assistant checks only when asked.
The third is stale platform rules. Models are trained on a snapshot, and ad platforms change the rules the plan depends on. Performance Planner's removal of Display and Video planning from March 9, 2026 is a recent example: a model trained before that date will cheerfully tell you to plan your Display line in a tool that no longer supports it. Where a platform rule affects the plan, check it on the platform's help page the day you write the plan, and record the date in the assumptions table.
For a longer look at which parts of planning a model does well and where it still needs a person in the chair, our article on AI media planning goes through the planning cycle step by step.
You know the plan works when the assumptions table changes before the budget does
A media plan template has done its job when the monthly review changes rows in the assumptions table and the budget moves as a consequence, rather than the other way round. If LinkedIn's cost per lead comes in at $800 against a planned $600, the first change is to table 7 and the second is to table 3, and both are written down with a date.
Three signs tell you the template is working inside your team. The weekly review takes a few minutes, because every metric already has a threshold and an action. The CMO's question about where a number came from gets answered by pointing at a row rather than by a meeting. And the plan for the following quarter starts from the updated assumptions table, so each quarter's plan is a little less of a guess than the last.
The sign that it isn't working is just as clear: the budget table changes every week and the assumptions table has not been touched since planning day. That usually means people are reacting to platform dashboards rather than to the deciding source, and the plan has quietly become a record of what was spent rather than a statement of what should happen.
Where to start this week
Copy the seven tables into a spreadsheet, fill table 7 from your own exports before you touch the budget, and run the six prompts against the result. If you would like the method set up around your team's data and review cadence, that is the work Scalewell does with paid media teams.
Frequently asked questions
What is the difference between a media plan and a media strategy?
A media strategy decides which audiences you need to reach, what each channel's job is and how success is measured. A media plan turns those decisions into numbers and dates: budget by channel and month, flighting by week, KPI thresholds and the assumptions behind them. Write the strategy first, because the plan's channel roles come straight from it.
How far ahead should a paid media plan cover?
Plan a quarter in detail and the year in outline. A quarter is long enough for a B2B lead to become an opportunity in most sales cycles, and short enough that the assumptions table stays current. The annual outline sets total budget and the big calendar moments, and each quarterly plan updates the assumptions before it splits the money.
What should a media plan template include for B2B?
A B2B media plan template should include objectives with a pipeline target and a deciding data source, audience segments with a buying stage, channel mix with a feasibility check per line, budget by month, flighting by week, KPIs with action thresholds, and an assumptions table that records CPC, conversion rates, lead to opportunity rate, win rate and deal size with a source for each.
Can ChatGPT or Claude build a media plan from scratch?
An assistant can fill a media plan template well when you upload your own performance exports and set rules that forbid invented numbers. Without your data, it produces plausible figures with no source behind them, which is worse than a blank cell. Supply the exports, use platform forecasting tools for the forecast inputs, and ask it to rank every assumption at the end.
How much of a paid media budget should go to testing?
There is no published figure that settles this, so treat any percentage as a choice rather than a benchmark. Ten percent held in reserve is a common starting point, released only against a written test brief that states what a win would look like. The reserve should never become an unlabeled top-up for a line that is behind plan.